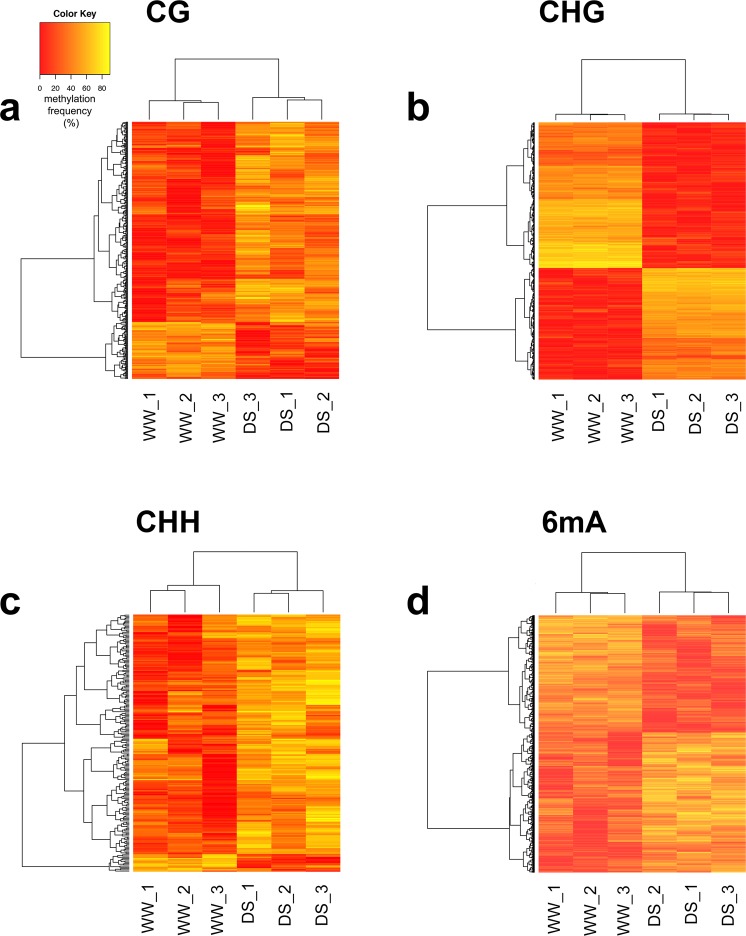
Figure 2.
Relative methylation frequencies of differentially methylated regions identified from the comparison between the well watered (WW) and drought stressed (DS) samples. Relative methylation frequencies of the differentially methylated positions contained in each differentially methylated region were averaged and used in complete linkage clustering analysis of samples derived from WW and DS based on 347 (a; CG), 836 (b; CHG), 205 (c; CHH) and 4338 (d; 6 mA) differentially methylated regions.

