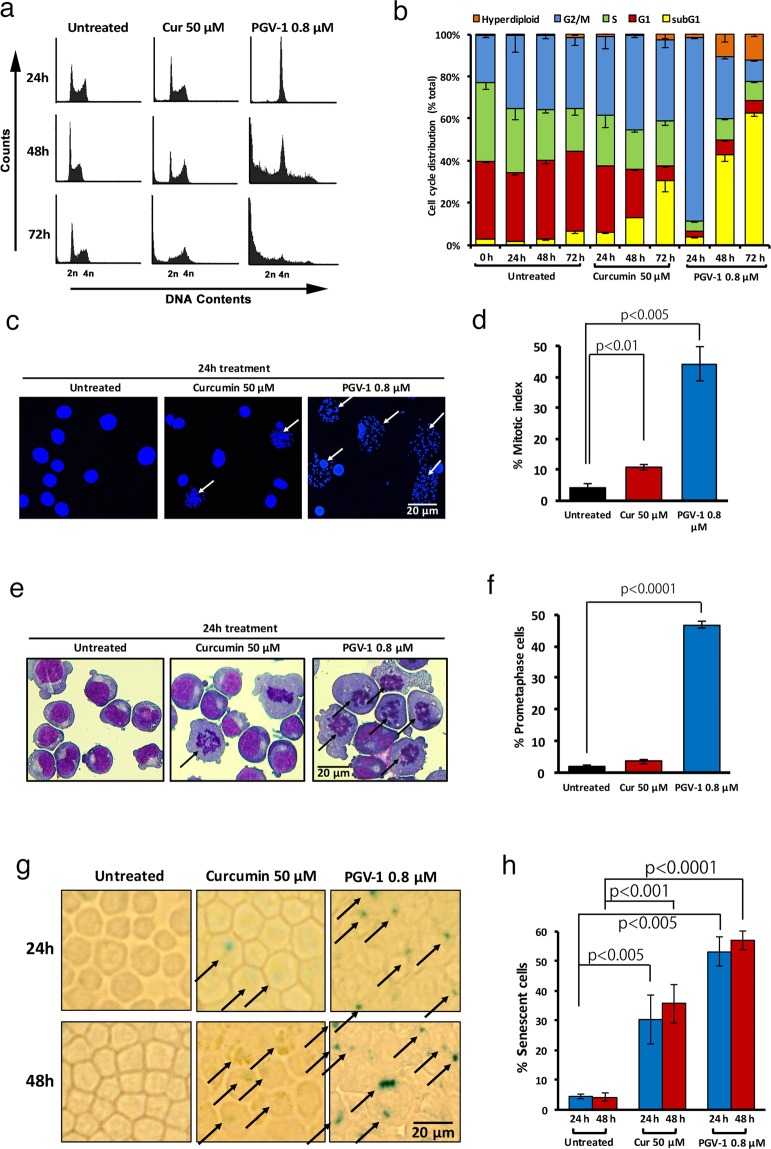
Figure 2.
Effects of curcumin and PGV-1 on tumor cell proliferation in vitro. (a) K562 cells (5 × 10⁵ cells/mL) were treated with curcumin (50 μM) and PGV-1 (0.8 μM) for 24, 48, and 72 hr, and then subjected to cell cycle analysis. (b) The percentage of cells in each phase as in panel A is shown as the mean ± SD from three independent experiments. (c) Mitotic spread of K562 cells treated with curcumin (50 μM) and PGV-1 (0.8 μM) for 24 hr. Chromosomal DNA was stained with Hoechst 33342 and viewed by confocal microscopy. Cells with no nuclear envelope are marked by arrows. The scale bar indicates 12.5 μm. (d) Mitotic indices calculated from three independent experiments as in panel c are shown as means ± SD. (e) K562 cells treated with curcumin (50 μM) and PGV-1 (0.8 μM) for 24 hr were stained with a May-Grunwald Giemsa solution. Cells with no nuclear envelope and condensed chromosomes that were not aligned along the metaphase plate are marked by arrows. The scale bar indicates 12.5 μm. (f) The percentage of prometaphase cells was calculated from three independent experiments as in panel e and is shown as the mean ± SD. (g) K562 cells treated with curcumin (50 μM) and PGV-1 (0.8 μM) for 24 and 48 hr were harvested on the cover glass by cytospin and stained for the β-galactosidase activity. Cells with positive SA-β-gal signals are marked by arrows. The scale bar indicates 50 μm. (h) The percentage of senescent cells (β-galactosidase-positive cells) was calculated. (n = 3).

