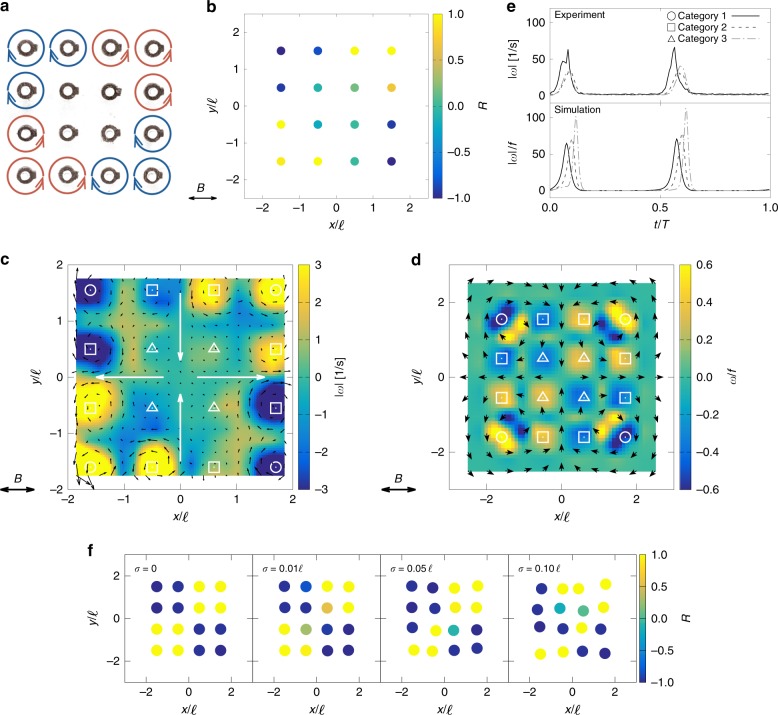
Fig. 3.
The quarter rotational pattern. a Schematic showing the rotational pattern under alternating magnetic field with and . b The rotational parameter of each rotor for a 4 × 4 rotor array. The dots depicts a single rotor, with blue meaning clockwise () and yellow meaning counter-clockwise rotation (). The observation is based on 25 cycles. c, d Time-averaged flow field generated by the rotors in c experiment ( and ) and d simulation ( and ). The contour shows the vorticity strength, the black arrows visualize the local flow field and the large gray arrows show net flow field created by the system. Symbols indicate the rotor position. e Time history of the vortex strength for three categories of rotors, in experiment and simulation. Note is the period. f Rotational pattern with a grid that has a Gaussian noise in the rotor position. The simulation is for and

