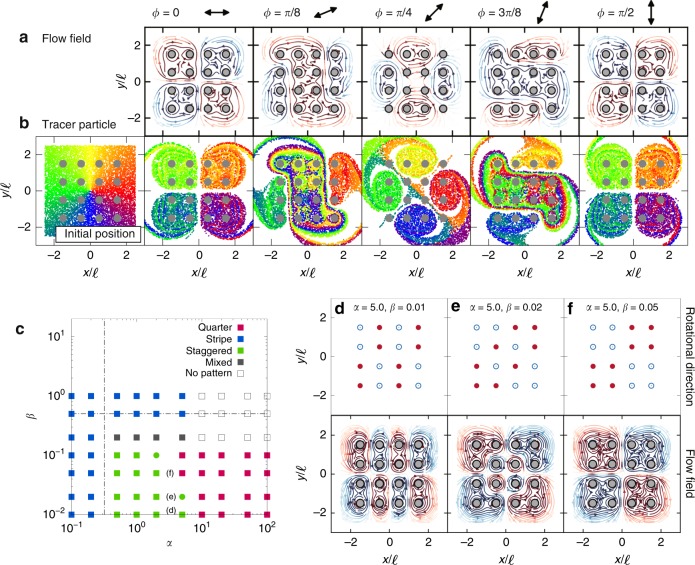
Fig. 4.
Generated flow fields and fluid mixing using the quarter and staggered patterns. a Generated flow field as a function of the external field direction for and . Streamline colours represent the vortex strength. b Tracer particle positions after 50 cycles of the external field actuation. c Phase diagram from the simulation in array. Vertical dotted line shows the theoretical prediction of critical value , while the horizontal dotted line shows the value . d–f Rotational patterns under three different conditions; red denotes counter-clockwise rotation, while blue denotes clockwise rotation. Bottom row shows generated flow field from the rotational patterns

