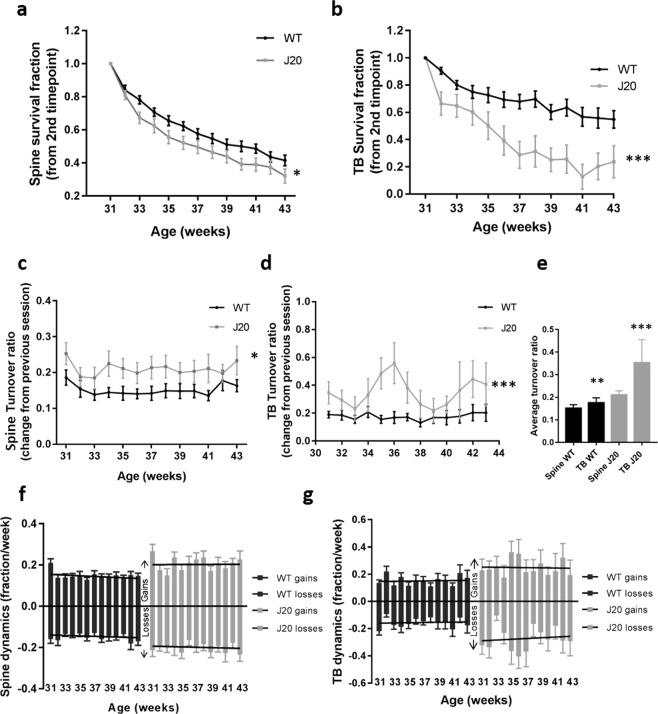
Figure 3.
The stability of dendritic spines and axonal terminaux boutons is altered in J20s. (a,b) Quantification of spine (a; two-way RM ANOVA genotype F(540,1) = 4.4, p = 0.04) and TB (b; two-way RM ANOVA genotype F(461,1) = 13.7, p < 0.001) survival, as a fraction of the first time-point (30 weeks), in J20s and WT controls. (c,d) TOR, showing the change compared to the previous session, of spines (c; two-way RM ANOVA genotype F(552,1) = 4.4, p = 0.04) and TBs (d; two-way RM ANOVA genotype F(471,12) = 112.3, p < 0.001) in J20s and WT controls. (e) Average total turnover across all time points showed a significant difference in spine and TB TOR in the J20 group but not in the WTs (two-way ANOVA F(103,1) = 6.3, p = 0.01). (f,g) Gains and losses of dendritic spines (f; two-way RM ANOVA gains genotype F(552,1) = 5.6, p = 0.02; losses genotype F(552,1) = 3.8, p = 0.06) and TBs (g; two-way RM ANOVA gains genotype F(482,1) = 5.8, p = 0.02; losses genotype × age F(482,12) = 2.5, p = 0.004) in J20s compared to WT controls. J20 spines n = 21, WT spines n = 34, J20 TBs n = 16, WT TBs n = 36. Error bars represent SEM.

