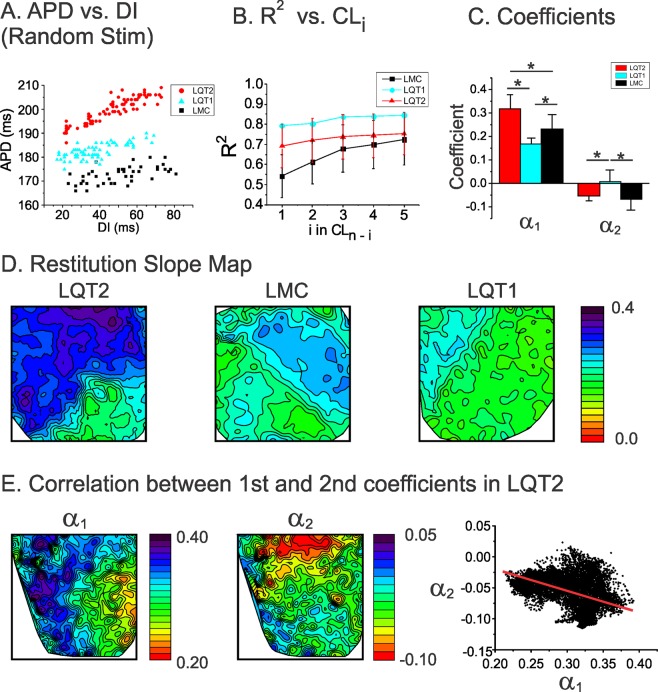
Figure 5.
APD restitution and short-term memory effect on APD dispersion. (A) Examples of APD restitution from LMC, LQT1, and LQT2 hearts using random stimulation protocol. Note that the restitution slope is greatest in LQT2 followed by LMC and LQT1. (B) Goodness of fit (R2) of multivariate analysis using where k is the kth previous beats. R2 including previous 10 beats were 0.848 ± 0.043, 0.85 ± 0.002, and 0.792 ± 0.093 for LMC, LQT1, and LQT2 respectively. (C) Coefficients (α1 & α2) from multivariate regression analysis (* indicates p < 0.05, One-Way ANOVA tests were performed between three groups and significant difference were founded at the 0.05 level. The differences of α1 in LMC vs LQT1, LQT1 vs LQT2 and LMC vs LQT2 are significant at the 0.05 level by Fisher test and the differences of α2 in LMC vs LQT1 and LQT1 vs LQT2 are significant at the 0.05 level by Fisher test). (D) Spatial patterns of 1st coefficients (α1) in LMC, LQT1, and LQT2 hearts. Note that the map of α1 from LQT2 shows greater spatial heterogeneities (0.09–0.39) compared to that of LMC and LQT1 hearts (standard deviation of slope map = 0. 064 ± 0.025 in LQT2 vs. 0.029 ± 0.008 and 0.030 ± 0.014 in LQT1 and LMC, n = 4 hearts each, p < 0.05, Student’s t-test where appropriate). (E) Spatial patterns of 1st and 2nd coefficients (α1 & α2) in LQT2. The map of α2 shows a spatial gradient with higher slope at the apex than the base, different from the α2 map. The α1 vs. α2 plot in the right panel shows negative correlation (−0.27 ± 0.10 in LQT2 vs. −0.07 ± 0.15 in LQT1, p < 0.05, n = 6 hearts, Student’s t-test where appropriate), indicating that the gradient direction in α2 is opposite that in α1.

