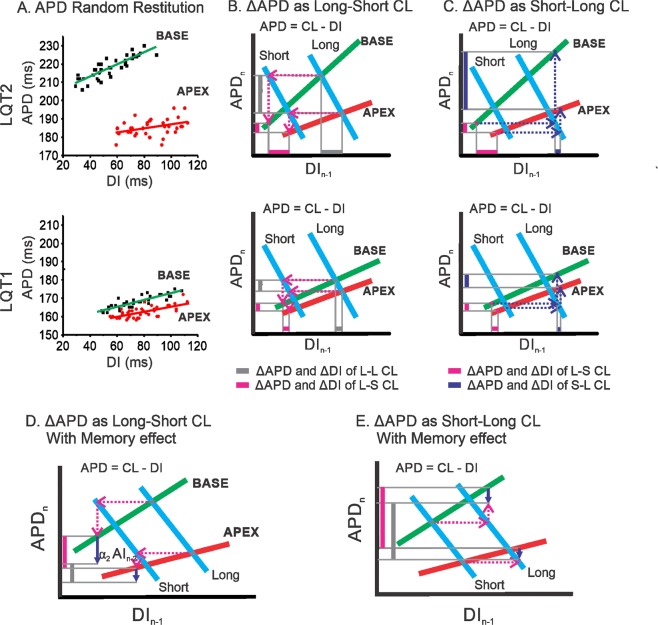
Figure 7.
Mechanisms of short-long CL enhancing APD dispersion in LQT2 (top) but not in LQT1 (bottom). (A) Scatter plot of APD vs. DI from base and apex showing heterogeneous restitution in LQT2, while heterogeneity in restitution is small in LQT1. (B) Illustration of enhanced APD dispersion under long-short CL. The red/green lines represent apex and base APD restitution curves, and the blue lines are the plots of the functional relation between APD and DI for a fixed CL, i.e., APD = CL − DI. The vertical bars indicate APD dispersion from long-long (grey) followed by a single short CL (magenta). (C) Enhanced APD dispersion in LQT2 under short-long CL changes due to heterogeneous restitution (purple vertical bar). (D) Illustration of APD dispersion reduced by the short-term memory effect in short-long CL. (E) Illustration of APD dispersion reduced by the short-term memory effect in long-short CL. The purple downward arrows indicate the APD adaptation direction and magnitude by the short-term memory effect of the previous CL (). In short-long CL, APD dispersion is less reduced by the short-term memory effect than in long-short CL. The step-by-step animation for this figure is available as a supplementary movie.

