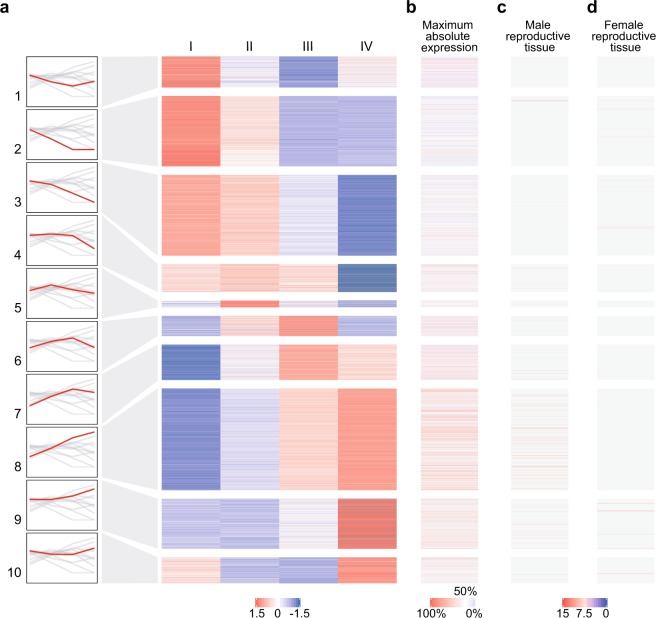
Figure 3.
Transcriptional profiling of annotated genes that are differentially expressed across the four germline populations. (a) False-colour k-means clustering heatmap summarizing the expression patterns (as Z-score of log2(FPKM + 1)) of annotated genes that are differentially expressed (P < 0.05 according to LRT) and have expression levels above 10 FPKM in at least one of the populations. The diagrams on the left report the expression trend of annotated genes for each cluster as log2(FPKM + 1). (b) Maximum absolute expression of each gene based on the highest log2(FPKM + 1) value detected across the four populations. (c) Absolute expression (as arbitrary unit of fluorescence intensity) of germline-enriched genes in adult males and (d) germline-enriched genes in adult females defined using MozAtlas microarray data27 (tau-value ≥ 0.8). Z-score and expression values are displayed according to colour codes to indicate: high levels (red) and low levels (blue) of expression, the 50th percentile (white), non-testis-enriched or non-ovary-enriched genes based on MozAtlas τ < 0.8 (grey) and not-applicable data from MozAtlas (light yellow).

