Figure 4.
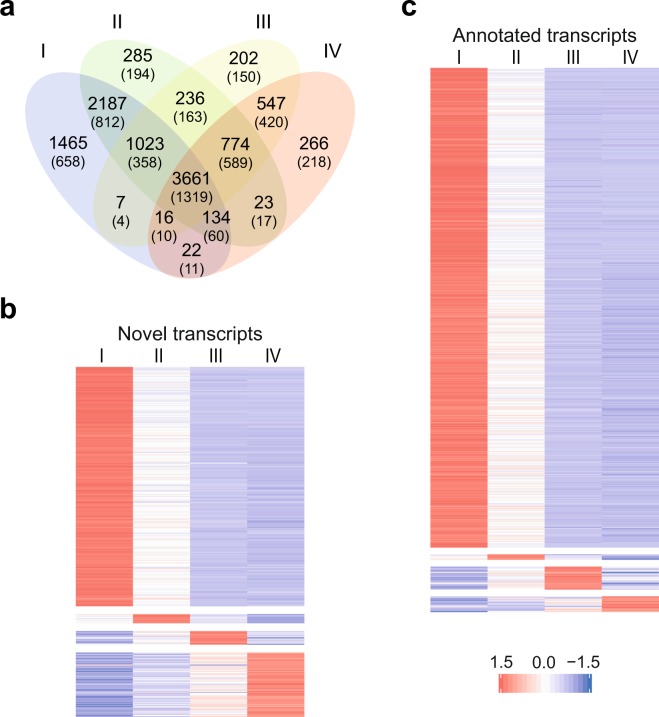
De novo transcriptome profiling of germline populations. (a) Venn diagram showing the number of transcripts identified via de novo transcriptome analysis of the four populations. The number of novel transcripts (not yet annotated in the AgamP4.8 genome) is given between parentheses. (b) False-colour k-means clustering heatmap showing the expression as Z-score of log2(FPKM + 1) of non-annotated (novel) transcripts and (c) annotated transcripts that are enriched in each of the four populations (fold change > 2 compared to each of the other three populations and adjusted P-value < 0.05). Only genes that showed expression above 1 FPKM in at least one of the cell populations were included in the de novo transcriptome analysis.

