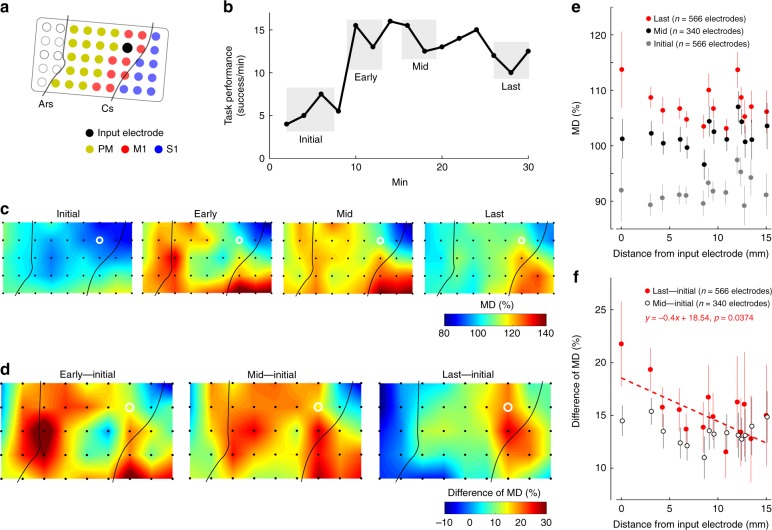
Fig. 4.
Targeted cortical adaptation during learning with an ACMC. a The ACMC input electrode in M1 is shown as a filled black circle. Electrical stimuli were applied to the flexor carpi radialis (FCR) muscle. Data were obtained from Monkey M. b Time course of task performance. The data obtained from the time intervals shown in grey shading were used to analyse the MDs of high-gamma activity. c Topographic map of MDs during the initial, early, mid, and last phases. d Differences in the MD spatial distribution between the initial and early, mid, and last phases. The white circles indicate the input electrode used for the ACMC. Electrodes not used for the ACMC are shown as black dots (c–d). Similar results were obtained from independent experiments in Monkey TE and M (n = 17 sessions, see also Figs. 5 and 6, Supplementary Fig. 11). e The relationship between MD and distance from the input electrode in Monkey TE and M (Initial, n = 566 electrodes from 17 sessions; Mid, n = 340 electrodes from 10 sessions; Last, n = 566 electrodes from 17 sessions). The grey, black and red circles represent MD in the initial, mid, and last phases, respectively. The MD continuously increased over initial, mid, and last phases (P < 10−5 by two-way ANOVA with Bonferroni’s correction for post hoc multiple comparisons). f The relationship between the difference of MD versus the distance from the input electrode in Monkey TE and M (Last - Initial, n = 566 electrodes from 17 sessions; Mid - Initial, n = 340 electrodes from 10 sessions). The black and red circles represent the difference of MD between the initial and mid phases (Mid - Initial) and between the initial and last phases (Last - Initial), respectively. A significant correlation between distance from the input electrode and difference of MD was found only in Last – Initial, shown as a red dotted line (Pearson correlation coefficient; R = −0.0875, P = 0.0374). Data in (e), (f) are shown as means and standard errors; detailed statistical results are included in the source data

