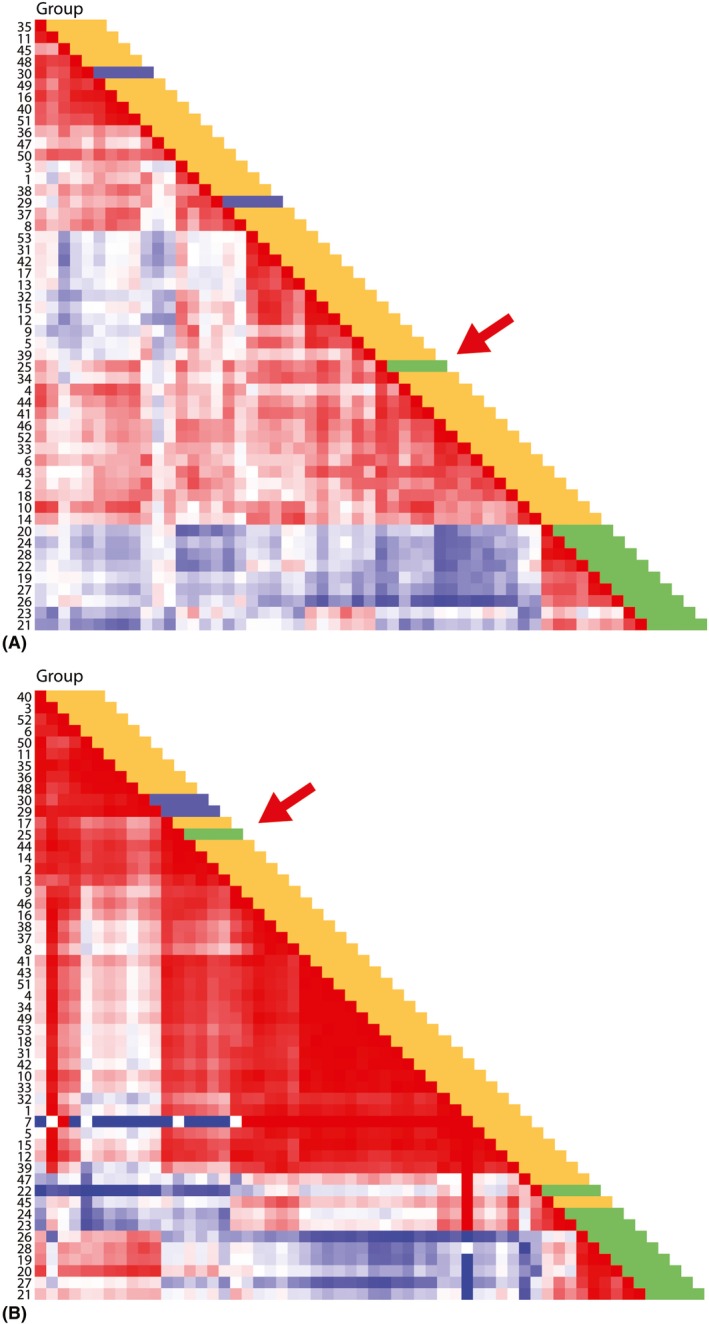
Figure 2.

Omniviz‐based visualization of soluble mediators in vitreous specimens. (A) HeatMapper analysis of cytokine, chemokine, growth factor levels, including interleukin (IL)‐10/IL‐6 ratio, shows clustering of 9/10 primary vitreoretinal lymphoma [(P)VRL], while 1 (P)VRL (sample 25) does not cluster (red arrow). Colours represent different diagnosis: green: (P)VRL; blue: multiple sclerosis (MS)‐related uveitis; yellow: other uveitis. (B) Same analysis with top seven of cellular and soluble mediator parameters shows clustering of 9/10 (P)VRL, except for the same (P)VRL as in (A) (sample 25; red arrow). Notably, the (P)VRL with a small B‐cell infiltrate (samples 22, 23, 24) form a subcluster, with coclustering of one non‐(P)VRL case (sample 45). Colours represent different diagnosis: green: (P)VRL; blue: MS‐related uveitis; yellow: other uveitis.
