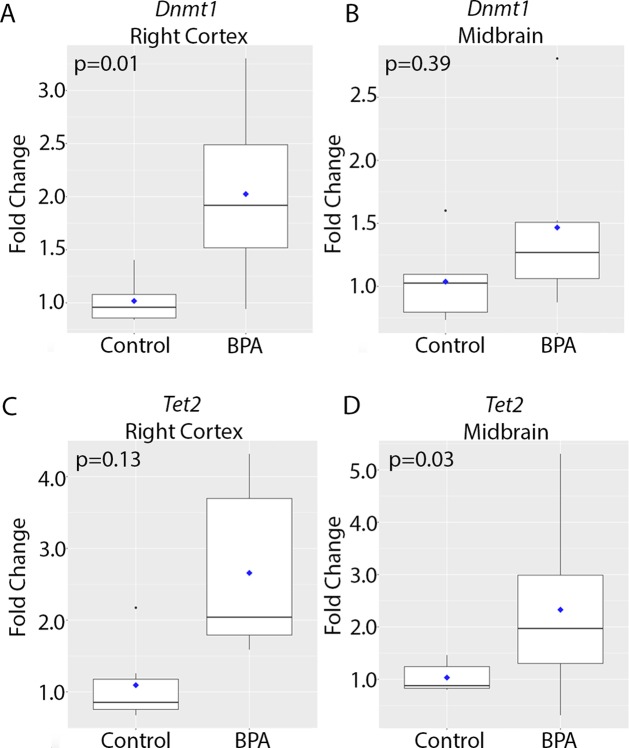
Figure 3.
Expression of genes encoding epigenetic modifying enzymes in the brain at 10 months of age in animals exposed to control vs. BPA. Box plots depicting qRT-PCR data for Dnmt1 (A, B) and Tet2 (C, D) in the right cortex (A, C) and midbrain (B, D). Data were analyzed using a two-sided non-parametric Wilcoxon test. Graphs depict the fold change in gene expression relative to the average of the control samples. n = 6 mice per exposure.

