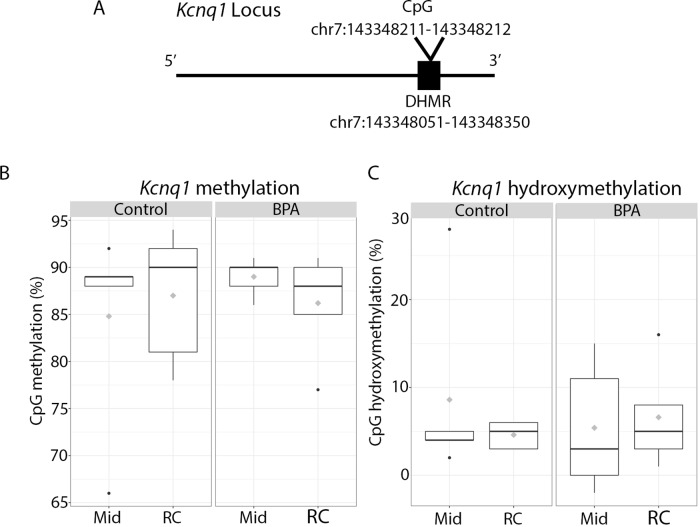
Figure 4.
Enrichment of 5mC and 5hmC at the Kcnq1 locus in 10 month old animals exposed to control vs. BPA. (A) Schematic of the Kcnq1 locus, depicting the location of the CpG analyzed in this study. This CpG falls within an intronic region that was previously identified to be differentially hydroxymethylated with BPA exposure (DHMR) in the blood (J Kochmanski et al., 2018). (B, C) Box plots depicting CpG methylation (B) and hydroxymethylation (C) in the midbrain (Mid) and right cortex (RC) in control vs. exposed offspring. Raw pyrosequencing data can be found in Supplementary Table 4 . Five samples from each exposure group/brain region passed the PyroMark quality control assessment and were used in the analysis. n = 5 mice per exposure/brain region.

