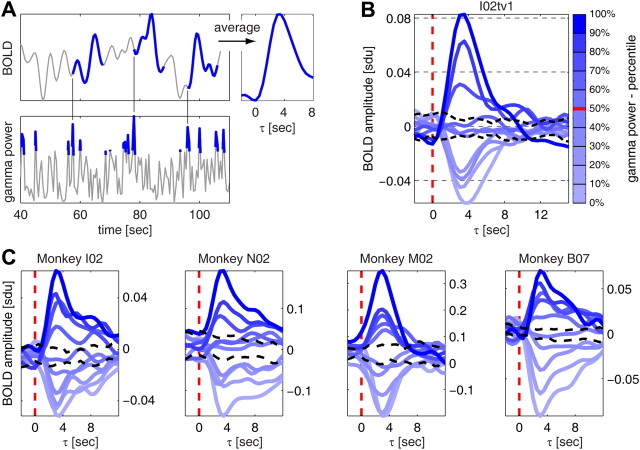
Figure 4.
The amplitude of the BOLD signal scales with gamma power. A, Illustration of the procedure for computing average changes in the BOLD signal following different intensities of gamma power. Data are from session I02tv1. Left, The top 10% gamma power data points and the BOLD signal in the 15 s following three of the detected high-gamma power events are highlighted in blue. Right, Average change in BOLD signal following the top 10% gamma power data points. B, Average changes in BOLD signal for each of the 10 percentile levels of gamma power (same data as in A). The significance levels (black dashed lines) were computed as the fifth and 95th percentile of the distribution of changes in BOLD signal following sets of randomly selected data points (the number of points in each random set being equal to the number of points in each of the 10 gamma percentile levels). C, Average changes in BOLD signal (same type of plot as in B) for four additional sessions. One representative session is shown for each monkey.

