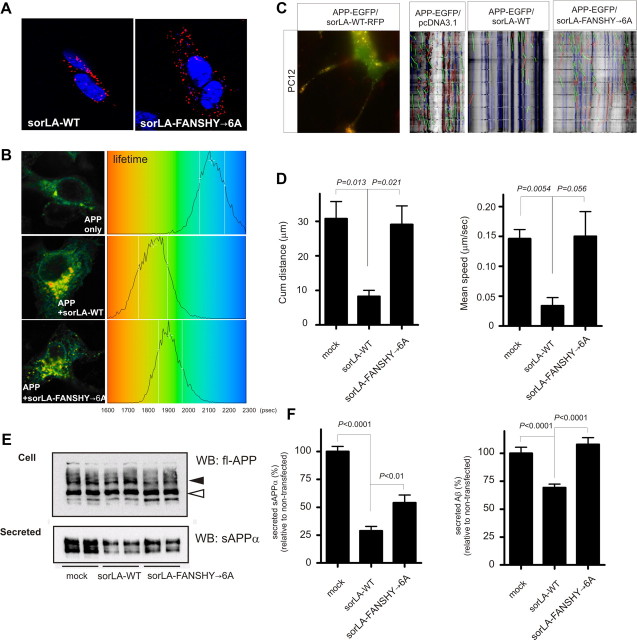
Figure 5.
Binding of sorLA to retromer decreases APP transport and amyloidogenic processing. A, PLA using SH-SY5Y cells stably expressing sorLA–WT or sorLA–FANSHY→6A and endogenous levels of APP. The red signal indicates protein–protein interactions between sorLA and APP. B, FLIM analysis of the interaction between APP and sorLA–WT or sorLA–FANSHY→6A in SH-SY5Y cells. Shown are pseudocolored FLIM images (left) and lifetime histograms (right). C, PC12 cells were transfected with APP–EGFP and sorLA–WT–RFP and differentiated by treatment with 50 ng/ml NGF to demonstrate colocalization between sorLA and APP in these cells. Vesicular movements were analyzed in PC12 cells, and representative kymographs from PC12 cells transfected with APP–EGFP in the absence of exogenous sorLA or cotransfected with sorLA–WT or sorLA–FANSHY→6A constructs are shown. Pausing vesicles are shown in blue, whereas vesicles moving anterograde and retrograde are colored in green and red, respectively. D, Histograms showing the average mean speed for APP and the cumulative distance traveled by APP. Total number of vesicles analyzed per condition were as follows: APP, 354 vesicles; sorLA–WT, 226 vesicles; sorLA–FANSHY→6A, 287 vesicles. The vesicles were imaged over three experiments (n = 3), and the data are represented as mean ± SE. E, APP metabolism in SH-SY5Y cells analyzed by WB of lysates (Cell) and conditioned medium (Secreted) of nontransfected cells and cells expressing either sorLA–WT or sorLA–FANSHY→6A. Mature and immature fl-APP (indicated by arrowheads) in the lysate was determined by antibody recognizing the C-terminal of full-length APP and secreted sAPPα was detected by the WO2 antibody. F, Levels of sAPPα and Aβ in medium from SH-SY5Y cells determined by quantification of WB analysis or an Aβ40-specific ELISA, respectively.

