
Figure 10.
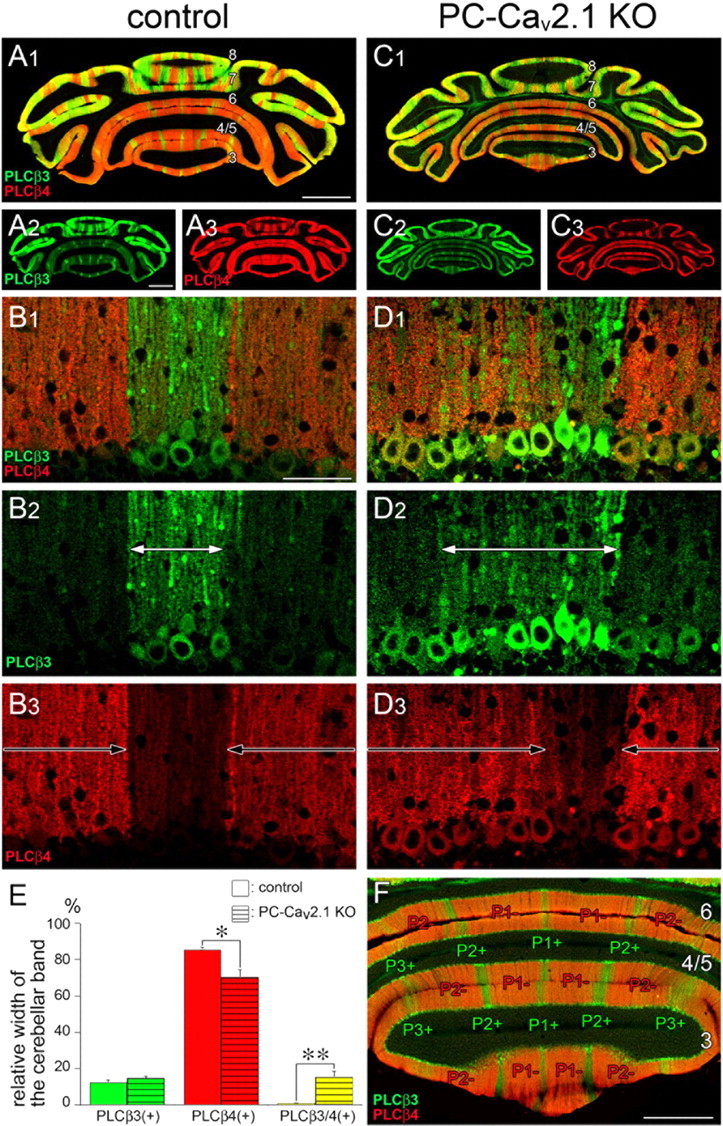
The sharp boundary in reciprocal distribution of PLCβ3 and PLCβ4 immunoreactivities in control mice is impaired in PC-Cav2.1 KO mice. A–D, F, Double immunofluorescence for PLCβ3 (green) and PLCβ4 (red) in horizontal cerebellar sections of control (A, B, F) and PC-Cav2.1 KO (C, D) mice at P21. White and black arrows in B and D indicate cerebellar compartments dominantly expressing PLCβ3 or PLCβ4, respectively. Numerals 3–8 indicate the lobule number. In F, the width of the cerebellar band was measured at the molecular layer compartments P1+, P1−, P2+, P2−, and P3+ of lobules 3–6. E, Histograms showing the width of PLCβ3-dominant (green), PLCβ4-dominant (red), and PLCβ3/4-double dominant (yellow) bands relative to the width of the total cerebellar bands measured. Open and striped bars indicate control and PC-Cav2.1 KO mice, respectively. The values for PLCβ3-dominant bands are as follows: 12.3 ± 1.4% in control and 14.6 ± 1.3% in PC-Cav2.1 KO mice, p = 0.25; PLCβ4-dominant bands, 85.6 ± 1.2% in control and 70.2 ± 4.0% in PC-Cav2.1 KO mice, p < 0.05; PLCβ3/4-double dominant bands, 0.8 ± 0.2% in control and 15.2 ± 3.4% in PC-Cav2.1 KO mice, p < 0.01 (mean ± SEM, n = 3 mice, U test). *p < 0.05; **p < 0.01. Scale bars: A, 1 mm; B, 50 μm; F, 500 μm.