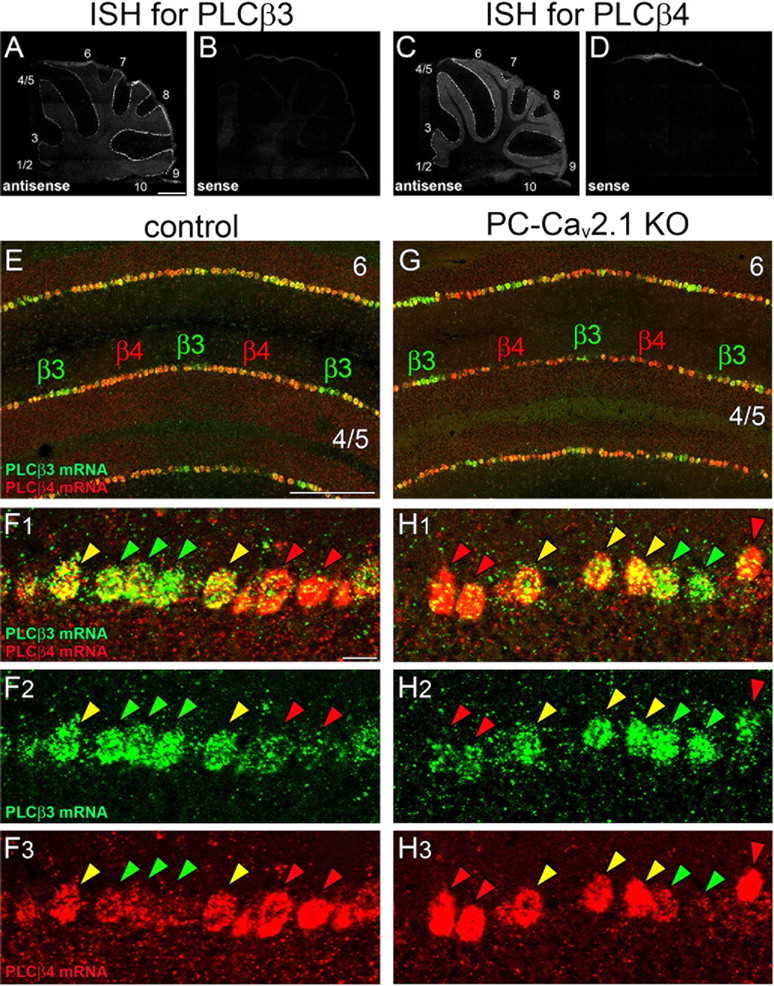
Figure 12.

Blurred boundary of cerebellar compartments dominantly expressing PLCβ3 or PLCβ4 mRNA in both control and PC-Cav2.1 KO mice. A–D, Specificity of riboprobes for PLCβ3 and PLCβ4 is indicated by reciprocal labeling of PC subsets with the use of antisense probes (A, C) and blank labeling with the use of sense probes (B, D). E–H, Double FISH for PLCβ3 (green) and PLCβ4 (red) mRNAs in horizontal cerebellar sections of control (E, F) and PC-Cav2.1 KO (G, H) mice. In both types of mice, PC subsets dominantly expressing PLCβ3 (β3, green arrowheads) and PLCβ4 (β4, red arrowheads) grossly alternate, but PCs highly expressing both isoforms intervene between them (yellow arrowheads). Numerals 1–10 indicate the lobule number. Scale bars: A, 500 μm; E, 20 μm; F1, 100 μm.
