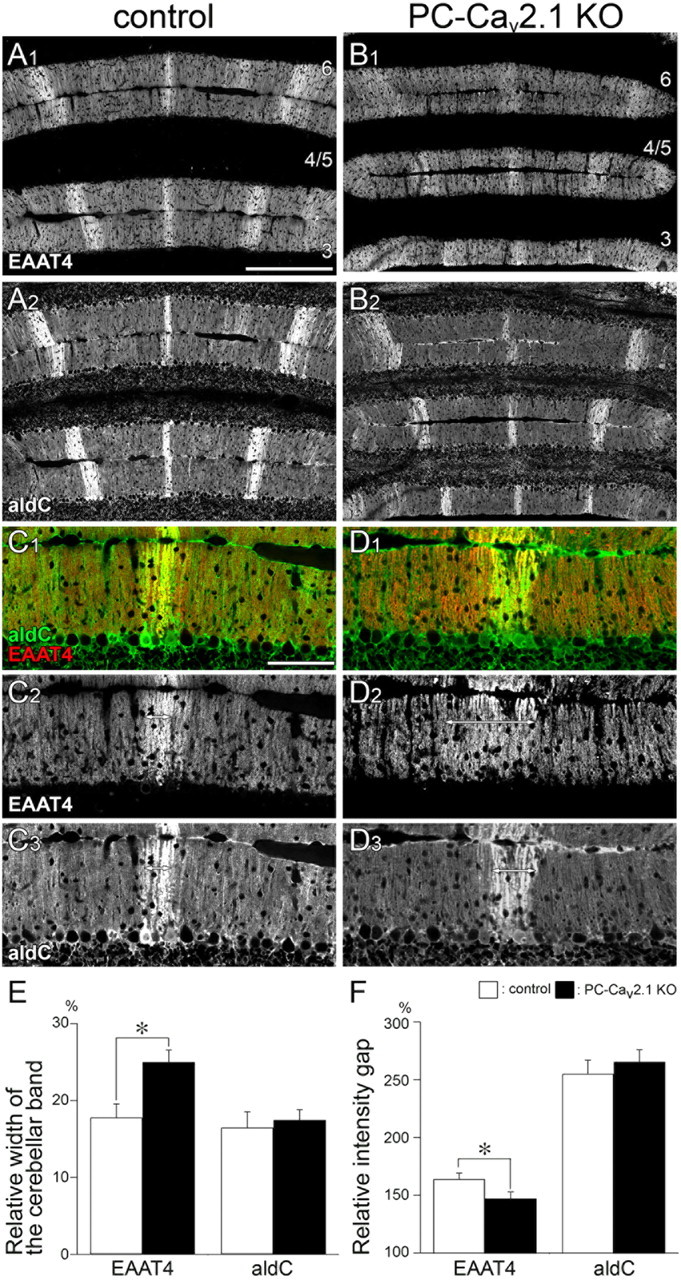
Figure 13.

Altered boundary for EAAT4 cerebellar compartments in PC-Cav2.1 KO mice at P21. Double immunofluorescence for EAAT4 (A1, B1, C1, C2, D1, D2) and aldolase C (aldC; A2, B2, C1, C3, D1, D3) in control mice (A, C) and PC-Cav2.1 KO mice (B, D) at P21. In control mice, EAAT4-strong bands closely match with aldolase C(+) bands (double-headed arrows in C2, C3). In PC-Cav2.1 KO mice, the boundary of EAAT4 compartments is less obvious and EAAT4-dominant bands are wider than aldolase C(+) bands (double-headed arrows in D2, D3). Numerals 3–6 indicate the lobule number. Scale bars: A, 200 μm; C, 100 μm. E, Histograms showing the relative width of the cerebellar band. The values for EAAT4 are 17.8 ± 1.7% in control and 25.0 ± 1.6% in PC-Cav2.1 KO mice, p < 0.05, whereas those for aldolase C are 16.5 ± 2.1% in control and 17.5 ± 1.3% in PC-Cav2.1 KO mice, p = 0.77 (mean ± SEM, n = 3 mice, U test). F, Histograms showing the relative intensity gap. The values for EAAT4 are 163.9 ± 5.3% in control and 147.1 ± 5.7% in PC-Cav2.1 KO mice, p < 0.05, whereas those for aldolase C are 255.1 ± 11.8% in control and 265.5 ± 10.5% in PC-Cav2.1 KO mice, p = 0.28 (mean ± SEM, n = 3 mice, U test). White and black bars indicate control and PC-Cav2.1 KO mice, respectively. *p < 0.05.
