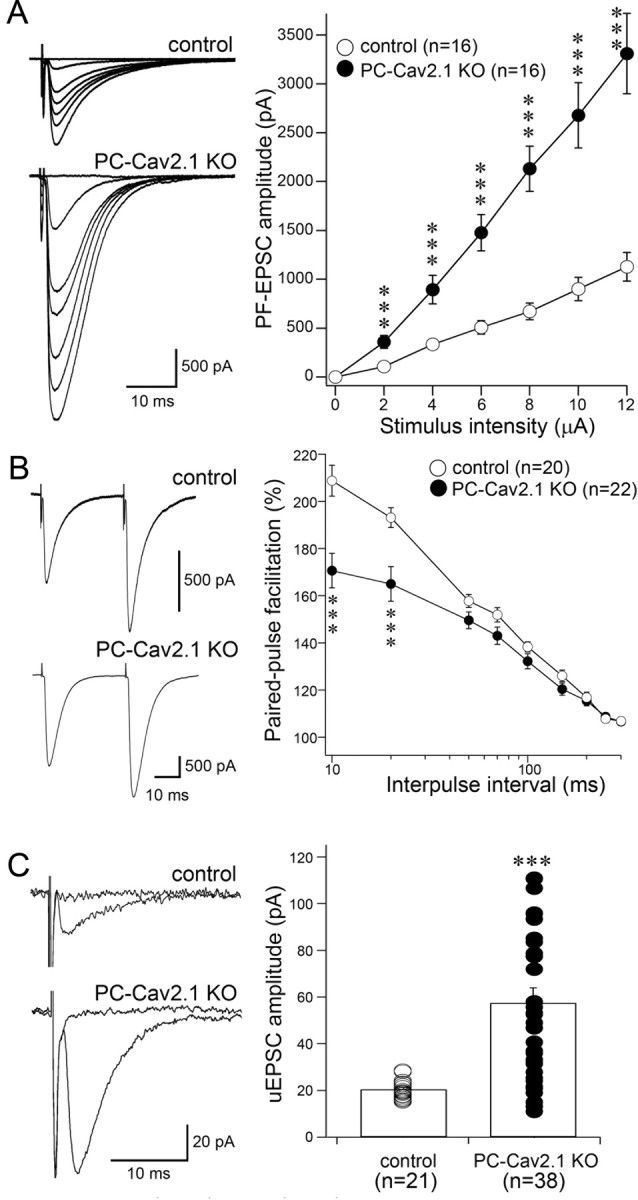
Figure 3.

Enhanced PF-to-PC synapse transmission in PC-Cav2.1 KO mice. A, Left, Representative traces of PF-EPSCs recorded at various stimulus intensities in the control (top) and the PC-Cav2.1 KO (bottom) PC. A, Right, Averaged input–output relationship of PF-EPSCs in control (white circles; n = 16 PCs) and PC-Cav2.1 KO (black circles; n = 16 PCs) PCs. B, Left, Representative traces of PF-EPSCs with an interpulse interval of 50 ms in control (top) and PC-Cav2.1 KO (bottom) PCs. B, Right, Paired-pulse facilitation of PF-EPSCs in control (white circles; n = 20) and PC-Cav2.1 KO (black circles; n = 22) mice. The amplitude of the second response is expressed as the percentage of the first response and is plotted as a function of interpulse intervals. Stimulus pairs were applied at 0.5 Hz. C, Left, Representative traces of PF response to a minimal intensity stimulation [unitary EPSC (uEPSC)] in control (top) and PC-Cav2.1 KO (bottom) PCs. C, Right, Amplitudes of unitary EPSCs in control (white circles; n = 21) and PC-Cav2.1 KO (black circles; n = 38) mice. Six, six, and eight traces are averaged at a holding potential of −80 mV for A, B, and C, respectively. ***p < 0.001, U test. Error bars indicate the SEM.
