Figure 8.

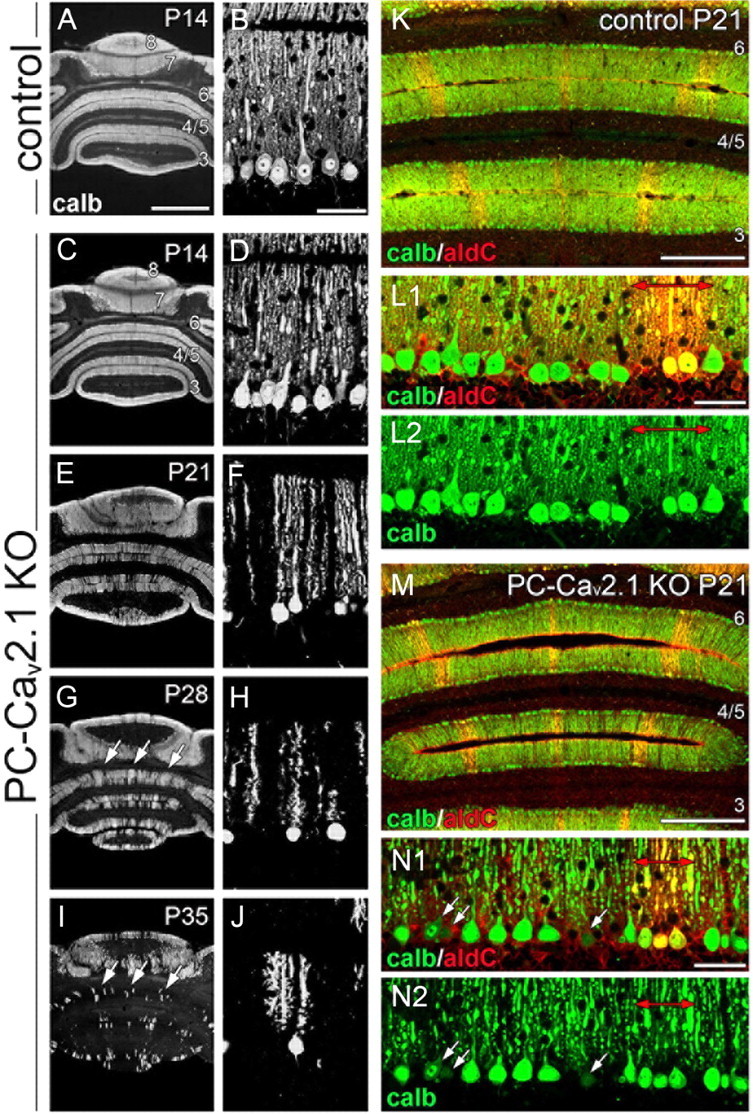
Progressive PC loss in aldolase C(−) cerebellar compartments of PC-Cav2.1 KO mice. A–J, Immunofluorescence for calbindin in horizontal cerebellar sections of control mice at P14 (A, B) and PC-Cav2.1 KO mice at P14 (C, D), P21 (E, F), P28 (G, H), and P35 (I, J). Arrows in G and I indicate banded clusters of remaining PCs. K–N, Double immunofluorescence for calbindin (calb; green) and aldolase C (aldC; red) in control (K, L) and PC-Cav2.1 KO (M, N) mice at P21. Red arrows in L and N indicate aldolase C(+) compartments. Arrows in N indicate that PC somata with lowered calbindin immunofluorescence were preferentially distributed in aldolase C(−) compartments. Numerals 3–8 indicate the lobule number. Scale bars: A, 1 mm; B, L, N, 50 μm; K, M, 500 μm.
