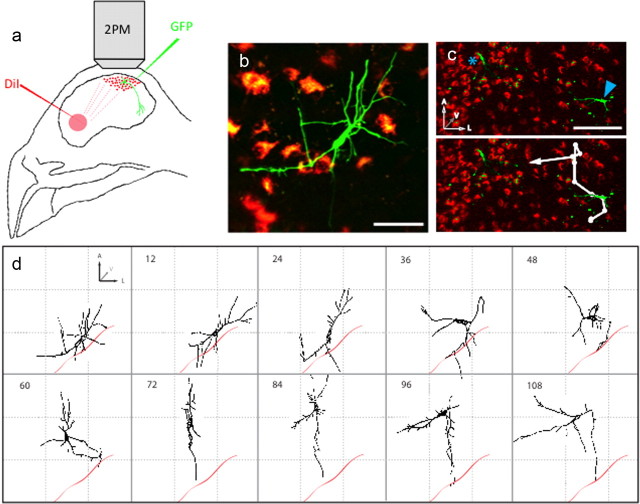
Figure 3.
Two-photon in vivo imaging reveals migration of cells with multipolar morphology. a, Schematic of the experimental setup for in vivo time-lapse imaging. New neurons were labeled by injecting an oncoretroviral vector carrying GFP into the VZ adjacent to HVC. Mature HVCX neurons (red dots) were retrogradely labeled with DiI injections into area X (red circle). We imaged HVC, from 4 to 22 dpi, with a two-photon microscope (2PM). Field of view was ∼700 × 1000 × 200 μm (depth). b, Example of a maximum intensity projection of a multipolar GFP+ cell (green) within HVC imaged in vivo at 7 dpi using two-photon microscopy. HVCX somata are labeled with DiI (red). Scale bar, 50 μm. c, Maximum intensity projection of two GFP+ multipolar cells (labeled in green and marked by a blue asterisk and a blue arrowhead) and DiI+ somata of HVCX neurons (red) at 8 dpi. Arrowhead indicates the same multipolar cell shown in b. Top shows the relative position of the two GFP+ cells. Scale bar, 100 μm. Bottom shows a reconstruction of the migratory trajectory of the multipolar cell in b (marked with a blue arrowhead) over 120 h (white line); white circles indicate the position of the cell body of the migrating cell recorded at 12 h intervals. Note that the cell moved a short distance over the first 12 h of its recorded trajectory; thus, the white circles for the first and second time points are partially overlapping. d, Reconstructed morphology for the multipolar cell shown in b and c at 12 h intervals. Time in hours is indicated in the top left corner. Red line indicates approximate location of the border of HVC. Grid spacing is 80 μm. A, Anterior; L, lateral; V, ventral.

