Figure 5.
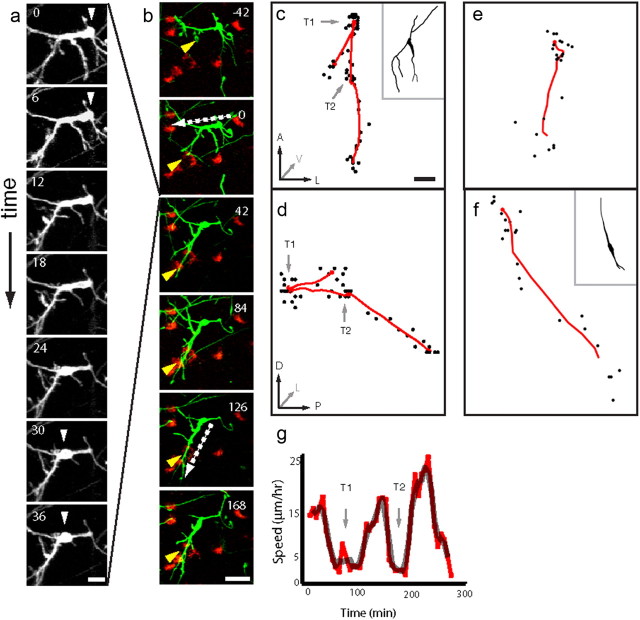
Multipolar cells move forward by soma translocation and change direction by soma invasion. a, b, Time-lapse series of migration in vivo for a single multipolar cell. Each image shows a maximal intensity projection of a GFP+ cell in HVC. a, Forward motion was accomplished by soma translocation along an existing process. Time, in minutes, is indicated in the top left corner of each panel. Arrowheads at t = 0, 6, 30, and 36 min identify the soma during the stationary phase. Scale bar, 10 μm. b, Direction change (at t = 126 min) was accomplished by the movement of the cell body into a newly extended process. Dashed arrows at t = 0 and 126 min indicate the upcoming direction of movement. Arrowhead at t = −42 min indicates the formation of the new leading process. GFP+ multipolar cell is shown in green, and surrounding DiI+ HVCX cells are labeled in red. Scale bar, 20 μm. c, d, Reconstruction of a 300-min migratory trajectory from a multipolar cell. Trajectory for the same cell is shown in the horizontal plane (c) and the sagittal plane (d) (A, anterior; P, posterior; D, dorsal; V, ventral; L, lateral). Black dots represent the location of the soma center at 6 min intervals, and the red line represents the smoothed trajectory (36 min sliding average). Scale bar, 5 μm. Gray arrows, labeled T1 and T2, indicate turns in the migration trajectory. The morphology of the multipolar cell in the horizontal plane is shown in the top right corner of c. e, f, Reconstruction of a 150 min migratory trajectory from a bipolar cell. The morphology of the bipolar cell in the sagittal plane is shown in the top right corner of f. g, Plot of soma speed versus time for the trajectory shown in c and d. Raw data (red line) and three-point sliding average (gray line) show speed calculated from smoothed trajectory in c and d. Turns T1 and T2 (gray arrows) occur during stationary phase.

