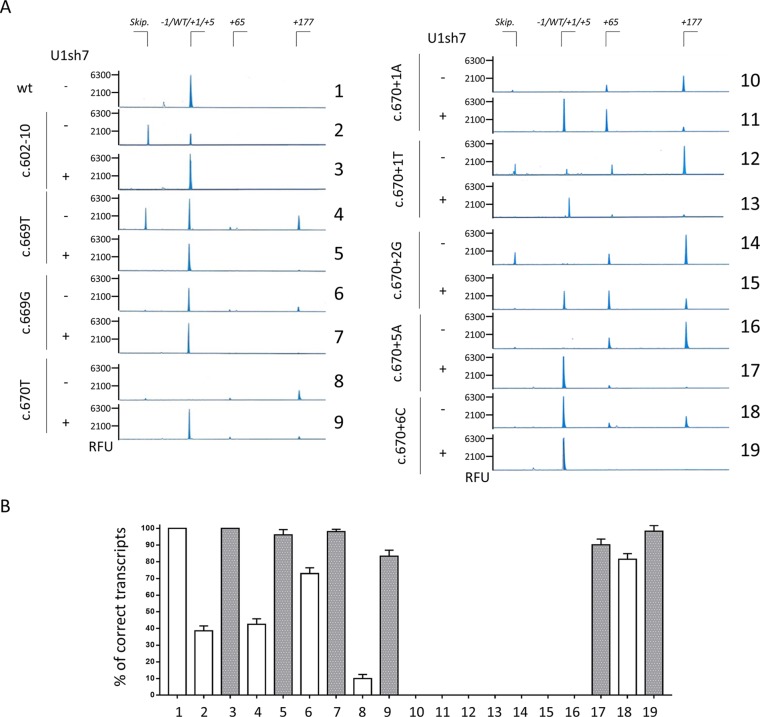
Figure 3.
Capillary electrophoresis-mediated analysis of splicing reveals the usage of an altered splicing registry.(A) Analysis of splicing patterns in HEK293T cells expressing mutant minigenes alone or in combination with ExSpeU1sRNAs7 by denaturing capillary electrophoresis of fluorescently-labelled PCR products. The amount of transcripts is represented by the area under each peak. The scheme of transcripts is reported on top. RFU: Relative Fluorescence Units. (B) Relative amount of correctly spliced transcripts in HEK293T cells transfected as in panel A and analyzed by denaturing capillary electrophoresis. The white and grey histograms report the percentage of correct transcripts expressed as mean ± SD from three independent experiments before or after treatment with U1sh7.

