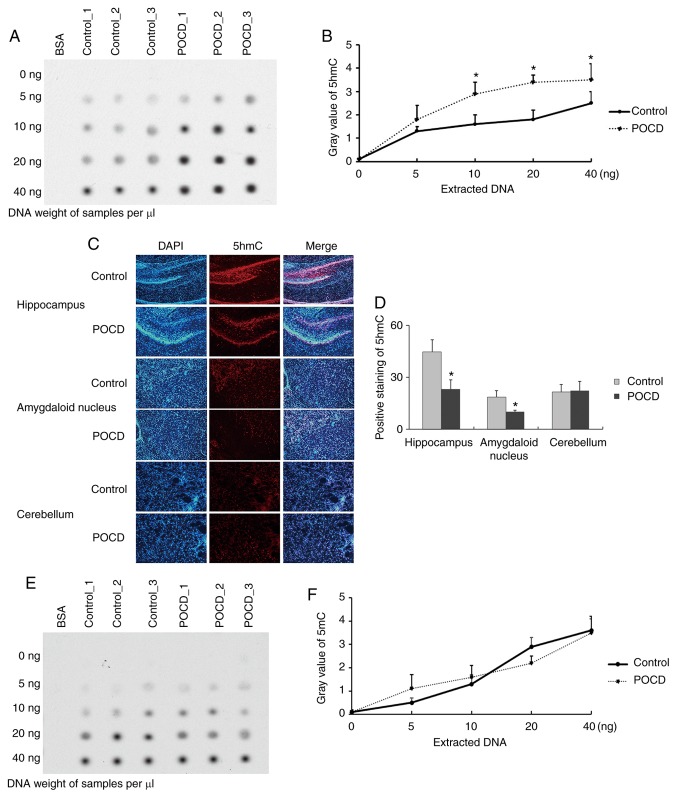
Figure 2.
Characterization of 5hmC level in the brain of POCD mice. The global 5hmC level of whole brain using (A) dot blot assay and (B) statistical analysis. The 5hmC distribution in hippocampus, amygdaloid nucleus and cerebellum using (C) immunofluorescence and (D) statistical analysis. The global 5mC level of whole brain using (E) dot blot assay and (F) statistical analysis. Gray value was defined as the mean of the integrated optical density of the pixels in the selection. All data are presented as the mean ± standard deviation of the mean of five independent experiments. *P<0.05 vs. control group. 5hMC, 5′hydroxymethylcytosine; BSA, bovine serum albumin; POCD, post-operative cognitive dysfunction.

