Fig. 6.
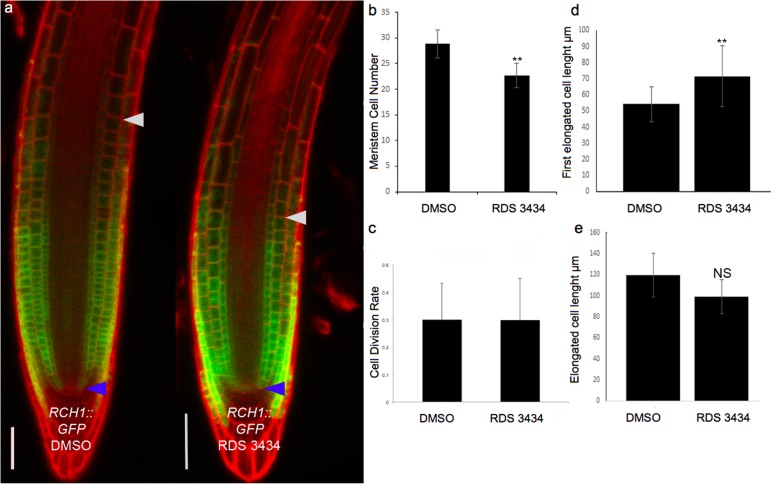
Inhibition of EZH2 affects root development. a Confocal microscopy images of RCH1::GFP roots from 5 days-old seedlings grown in the presence of RDS 3434 (240 μM) or DMSO as control. Blue and white arrowheads indicate the Quiescent Center (QC) and the cortex Transition Boundary (TB), respectively. b Root meristem cell number. c Quantification of GUS spots per meristem in treated and untreated of CYCLINB1;1pro:CDB-GUS roots. d, e Length of the first elongated cell (d), and of the differentiated cell (e) (n = 30). Data represent the mean of two independent biological replicates, presented with SD values. Significant differences were analyzed by t-test (*P ≤ 0.05, **P ≤ 0.01)

