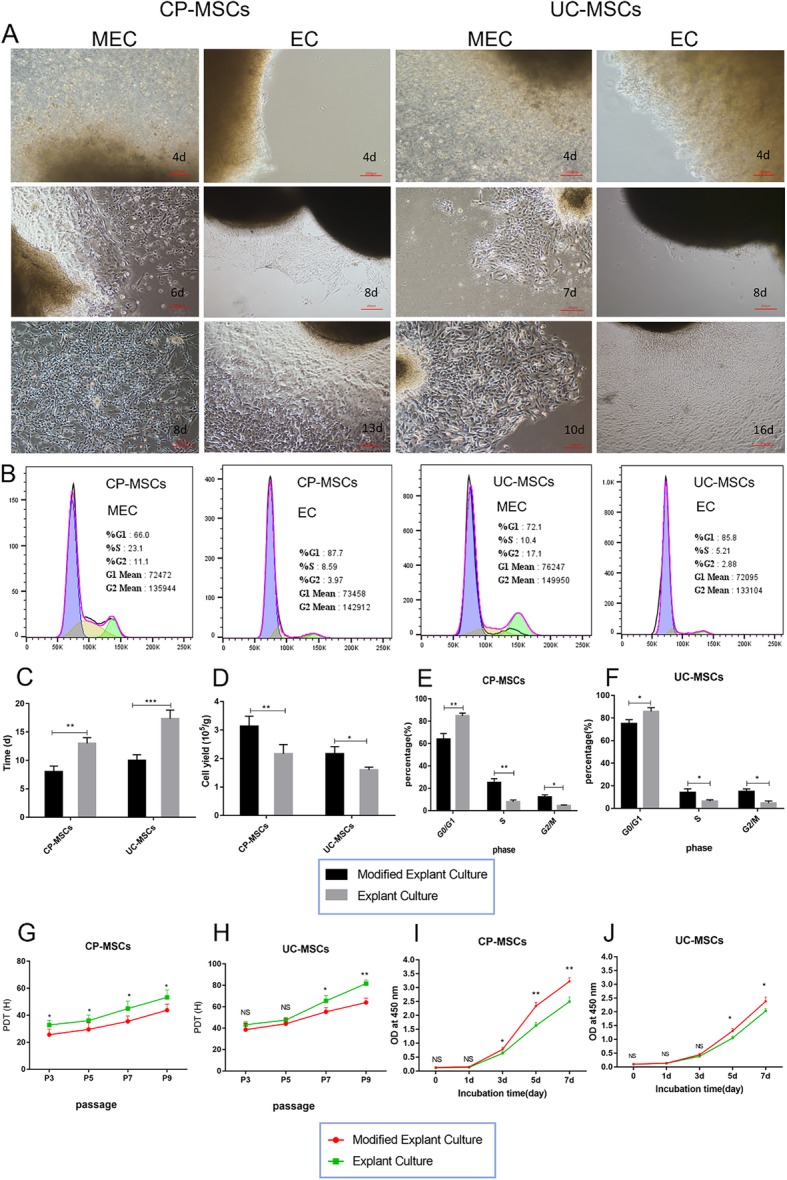
Fig. 2.

The MEC method is superior to the EC method in terms of efficiency and proliferative properties. a Representative diagrams of CP-MSCs and UC-MSCs during MEC and EC (100-fold magnification). b Cell cycle diagram of MSCs obtained by MEC and EC. c The mean time to the first passage of CP-MSCs and UC-MSCs in the MEC and EC groups. d The mean cell yield for the first passage of CP-MSCs and UC-MSCs in the MEC and EC groups. Statistical charts of cell cycle analysis of CP-MSCs (e) and UC-MSCs (f) obtained by MEC and EC (N = 3, P4). PDT of CP-MSCs (g) and UC-MSCs (h) obtained by MEC and EC (N = 3, n = 3). CCK-8 assay of CP-MSCs (i) and UC-MSCs (j) obtained by MEC and EC (N = 3, n = 6, P4). All data are expressed as the means ± SD (*p < 0.05, **p < 0.01, ***p < 0.001, NS, no significant). MEC, modified explant culture; EC, explant culture; PDT, population doubling time
