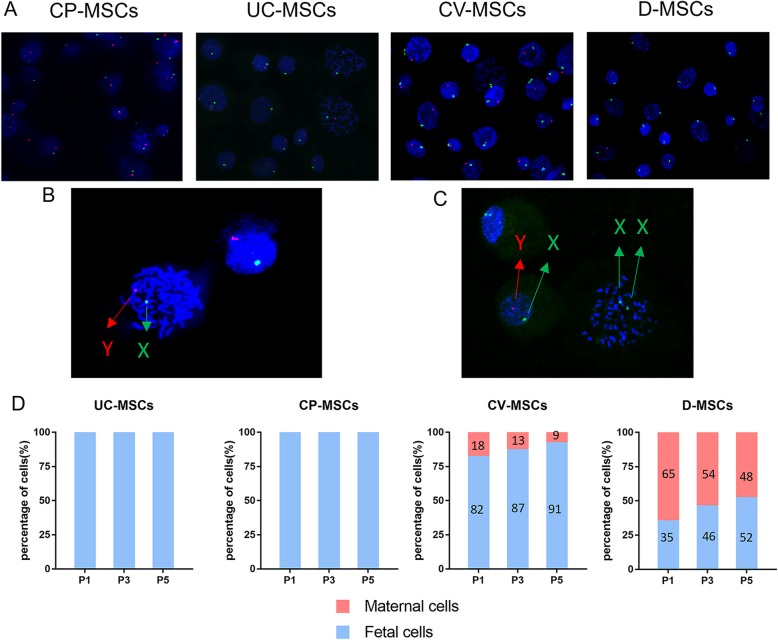
Fig. 4.
CP-MSCs are of fetal origin and superior to other P-MSCs in the origins. a XY-FISH plots of MSCs (green dots represent X chromosome, red dots represent Y chromosome, P3). b Magnified view of FISH results from CP-MSCs. c Magnified view of FISH results from CV-MSCs. d Quantitative determination of fetal (male) and maternal (female) cells during ex vivo expansion of all MSCs using XY-FISH. The X-axis represents passage numbers, and the Y-axis represents the percentage of XY male (blue) or XX female (red)

