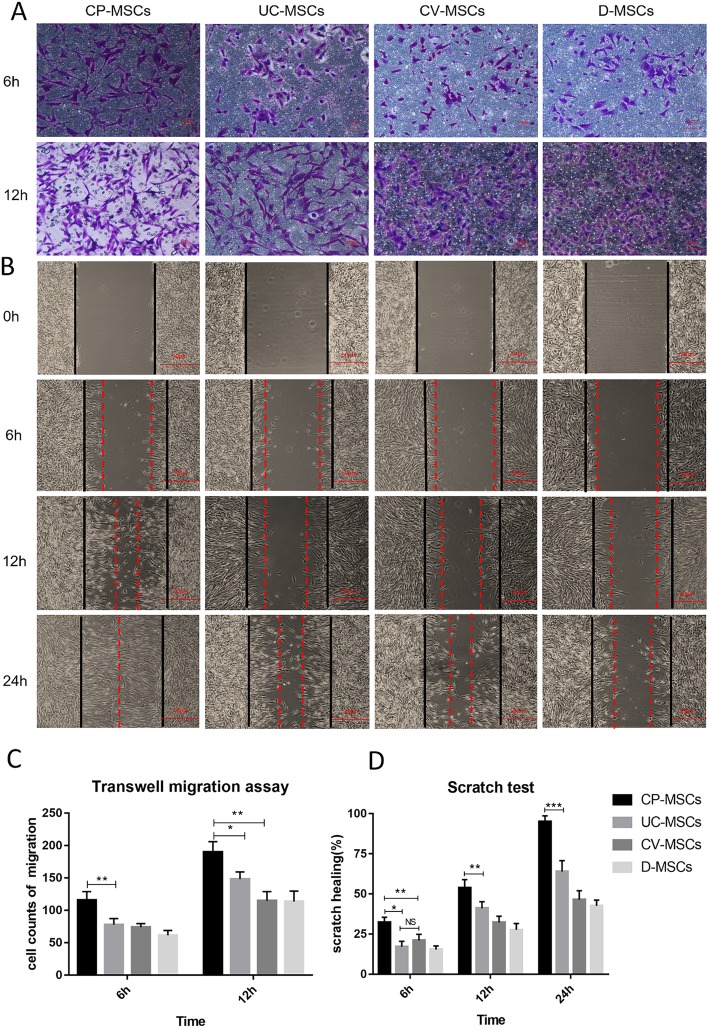
Fig. 6.
CP-MSCs show stronger migration capability. a Representative images of MSC transwell migration assay at 6 h and 12 h (200-fold magnification). b Representative figures of MSC scratch test at 0 h, 6 h,12 h, and 24 h (the black line indicates the scratch width at 0 h, and the red dotted line indicates the scratch width at each time point, 40-fold magnification). c Cell counts of transwell migration at 6 h and 12 h. d Healing area/wounded area ratio in scratch test analysis at 6 h, 12 h, and 24 h. All data are expressed as the means ± SD (N = 3, *p < 0.05, **p < 0.01, ***p < 0.001, NS, no significant)

