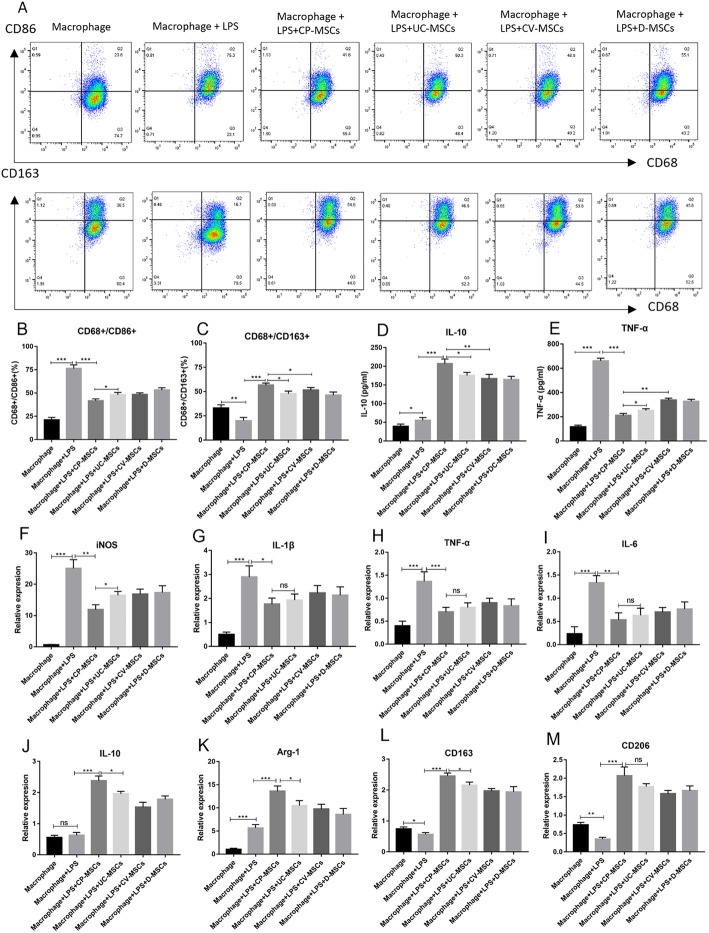
Fig. 7.
CP-MSCs show greater ability to regulate macrophage from M1 to M2. a–c Flow cytometry analysis of macrophage polarization, M1 polarization marker (CD86), M2 polarization marker (CD163). d, e The concentration of TNF-a and IL-10 in the cell culture supernatant. f–m The expression of major M1 markers (IL-1β, TNF-α, iNOS, and IL-6) and M2 markers (IL-10, Arg-1, CD163, and CD206). All data are expressed as the means ± SD (N = 3; *p < 0.05, **p < 0.01, ***p < 0.001, NS, no significant)

