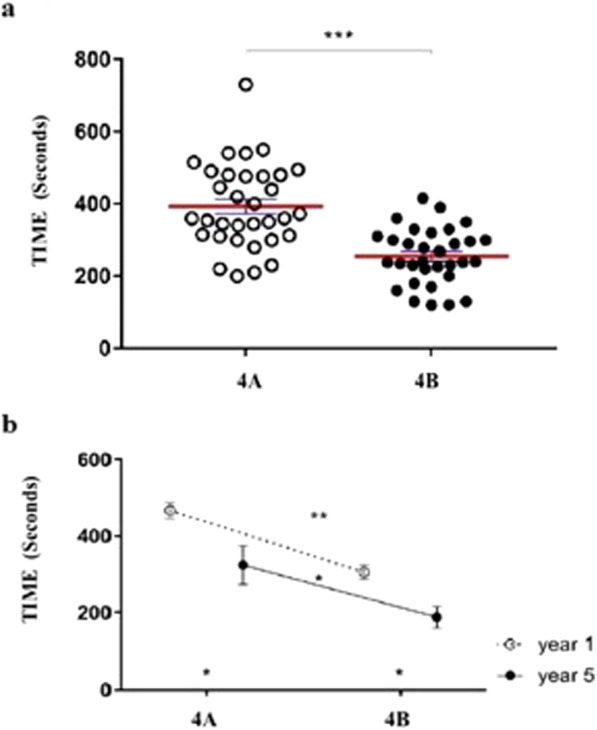
Fig. 4.

a. White spots: time before simulation in exercise 4; Black spots: time after simulation in exercise 4; ***: p value < 0,0001). b. White spots: mean times before (A) and after (B) simulation for trainees of the first year; Black spots: mean times before (A) and after (B) simulation for trainees of the last year **: p value 0.0019 *: p value 0.0182)
