
Fig. 2.
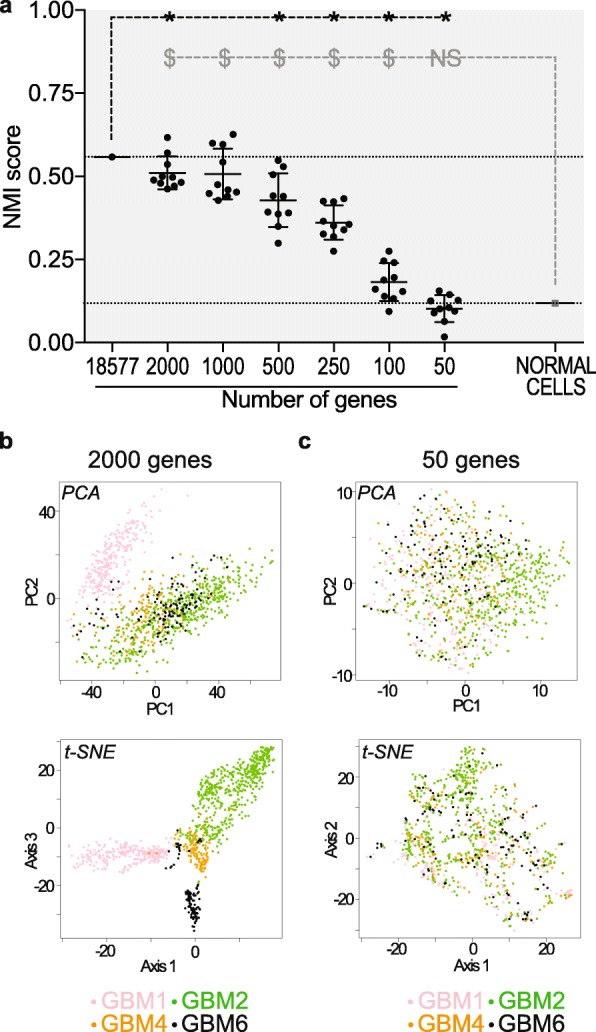
Down-sampling gene numbers relieves tumor-driven cell grouping. a Decreased Normalized Mutual Information (NMI) score when reducing gene numbers used for grouping analyses. Ten independent analyses performed with randomly selected genes for each gene number analyzed. Mean ± SD. One-sample t-test. * p < 0.01 compared to the NMI score of the grouping analysis performed with all genes detected in GBM cells. $ p < 0.0001 compared to the NMI score of the grouping analysis performed with all 19,699 genes detected in the dataset of normal cells. Note that NMI scores consistently decrease below 500 genes analyzed, reaching values similar to the NMI score of the grouping analysis of normal cells only in grouping analyses performed with 50 genes. b Example of a cell grouping analysis using 2000 randomly sampled genes. The clusters are predominantly composed of cells from a single tumor. Each dot represents a cell colored according to its tumor of origin. PCA and tSNE visualizations in upper and lower panels, respectively. c Example of a cell grouping analysis using 50 randomly sampled genes. Cells from a given tumor are distributed in different clusters. Each dot represents a cell colored according to its tumor of origin. PCA and tSNE visualizations in upper and lower panels, respectively