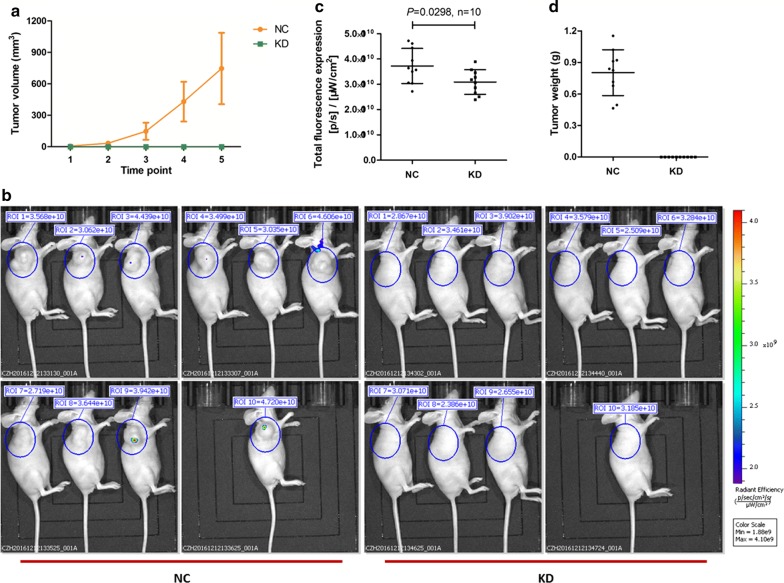
Fig. 3.
The effect of PYCR1 interference in vivo. a The change of tumor volume between NC group and KD group. After the diameter of tumor was larger than 5 mm, tumor volume was determined twice per week. Tumor volume = length * width2 * 0.52. b The bioluminescence imaging in NC group and KD group before sacrifice. c The scatter plot of total fluorescence expression in different groups. Compared with NC group, total fluorescence expression was significantly lower in KD group (P = 0.0298). d The tumor weight in NC group and KD group when sacrifice. Tumor weight was significantly increasing in NC group, while the tumors scarcely formed in KD group. N = 10. Values were expressed as mean ± standard deviation

