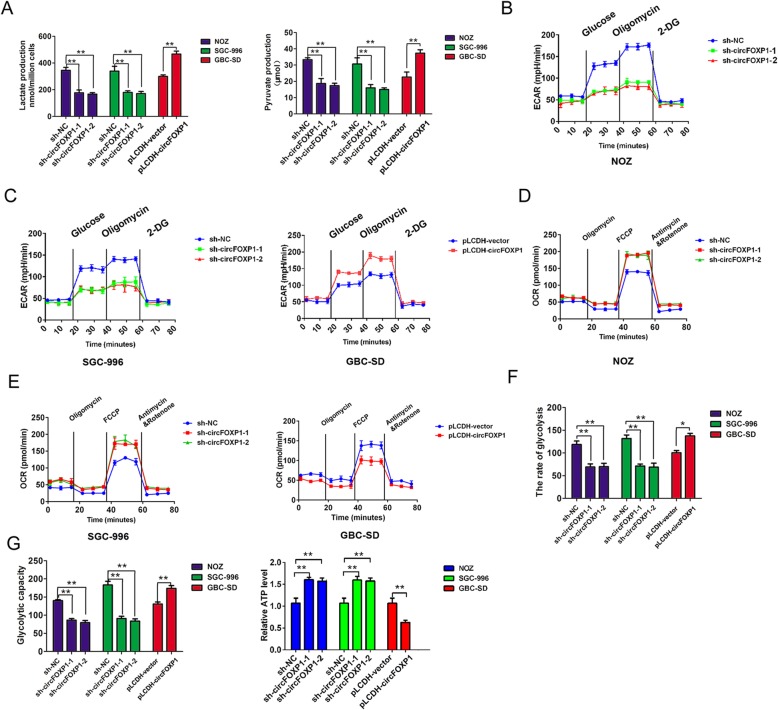
Fig. 3.
circFOXP1 promotes the Warburg effect in GBC cells. a Alterations in lactate production (left) and pyruvate production (right) levels were analyzed after transfection of NOZ and SGC-996 cells with sh-NC, sh-circFOXP1–1 or sh-circFOXP1–2 or GBC-SD cells with pLCDH-vector and pLCDH-circFOXP1, **P < 0.01. b, c The extracellular acidification rate was analyzed after transfection of NOZ and SGC-996 cells with sh-NC, sh-circFOXP1–1 or sh-circFOXP1–2 or GBC-SD cells with pLCDH-vector and pLCDH-circFOXP1. d, e The oxygen consumption rate was analyzed after transfection of NOZ and SGC-996 cells with sh-NC, sh-circFOXP1–1 or sh-circFOXP1–2 or GBC-SD cells with pLCDH-vector and pLCDH-circFOXP1. f, g The glycolysis rate, glycolysis capacity and ATP level was detected after transfection of NOZ and SGC-996 cells with sh-NC, sh-circFOXP1–1 or sh-circFOXP1–2 or GBC-SD cells with pLCDH-vector and pLCDH-circFOXP1. The extracellular acidification rate after glucose treatment indicates the glycolysis rate. The extracellular acidification rate after oligomycin treatment indicates the glycolysis capacity. Abbreviations: 2-DG, 2-deoxy-d-glucose; ECAR, extracellular acidification rate, **P < 0.01

