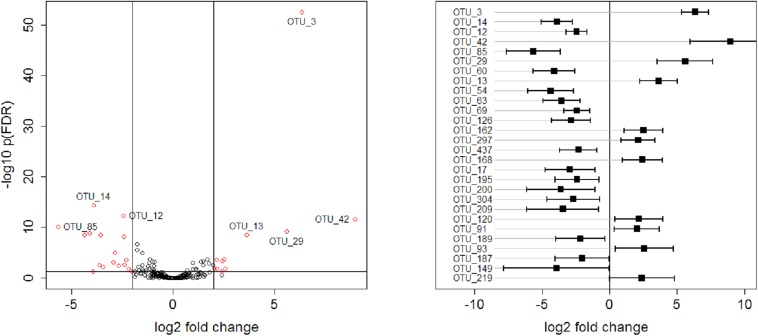
FIGURE 5.
Left: Volcano plot representing –log10 FDR-adjusted p-values versus log2 fold changes for all 216 OTUs. Right: log2 fold changes of 28 OTUs, selected with a criterion of FDR-adjusted p-values < 0.05 and absolute log2 fold change >2. OTUs are ordered according to p-values, with the OTU_3 having the smallest p-value. Confidence intervals were calculated according to Jung et al. (2011).

