Figure 1.
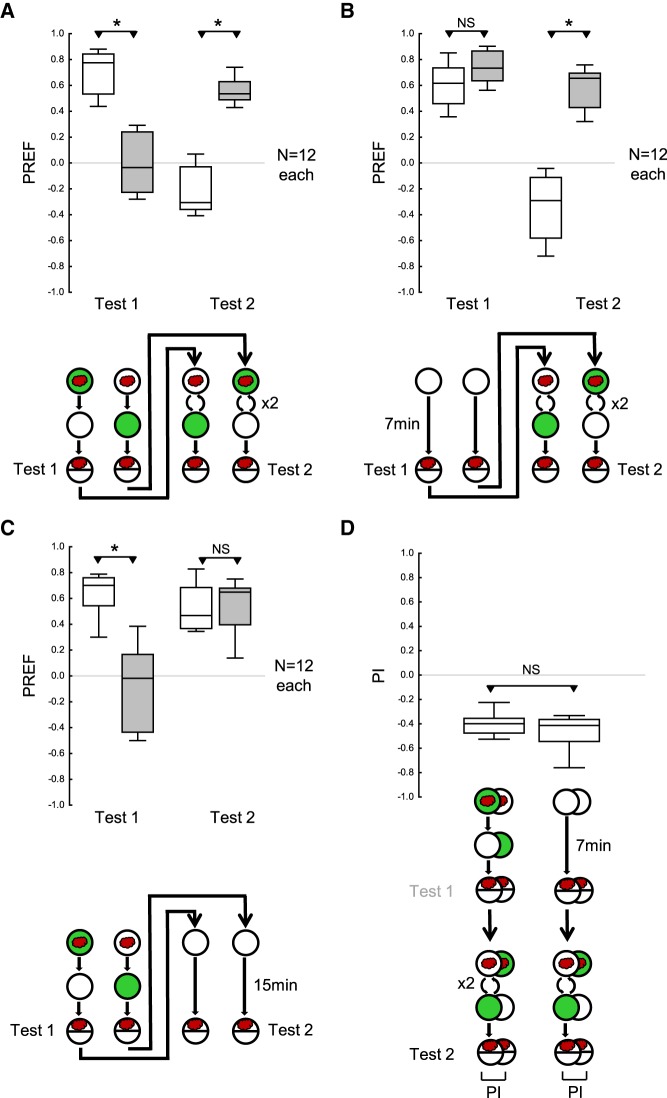
Drosophila larvae adapt to changes in odor–reward contingency. (A) One group of stage 3 larvae received paired odor–reward training; that is, they were exposed to the odor n-amyl acetate (red cloud) on a Petri dish with an agarose substrate with a fructose reward added (green fill of Petri dish), and then transferred to a Petri dish with just the agarose substrate (white fill of Petri dish) and no odor. The second group of larvae was trained reciprocally, that is, with unpaired presentations of the odor and the reward. After one such training cycle there followed the first test of odor preference (Test 1), and a second training phase with two cycles of training with reversed contingencies of the odor and the reward. Then, the larvae were tested again for their odor preference (Test 2). In the first test, the larvae showed higher levels of odor preference after paired than after unpaired training. This pattern of results was reversed during the second test. Thus, after the first training phase, the larvae behaved according to the odor–reward contingencies during the first training phase, whereas after the second training phase their behavior was largely in accordance with the reversed contingencies in the second training phase. (B) As in A, except that the first training phase was replaced by a waiting period of 7 min on a Petri dish with just the agarose substrate. The larvae showed equal levels of odor preference in the first test. In the second test, they behaved according to the odor–reward contingencies during the second training phase. (C) As in A, except that the second training phase was replaced by a waiting period of 15 min on a Petri dish with just the agarose substrate. In the first test, the larvae behaved according to the odor–reward contingencies during the first training phase; this effect had vanished by the time of the second test. (D) Performance indices (PI) calculated from the difference in preference scores between paired versus unpaired training, for the second test of the experiments shown in A (left plot) and B (right plot), respectively. Negative PI scores indicate appetitive associative memory in accordance with the second training phase. PIs are equal regardless of whether or not there had been odor–reward training during the first training phase. This conforms to the conclusion from C that there was no measurable impact of the first training phase on larval behavior during the second test. Data are displayed as box plots, the middle line showing the median, the box boundaries the 25% and 75% quantiles, and the whiskers the 10% and 90% quantiles. Sample sizes are given within the figure. * and NS refer to MWU comparisons between groups (* P < 0.05 corrected according to Bonferroni-Holm and NS P > 0.05).

