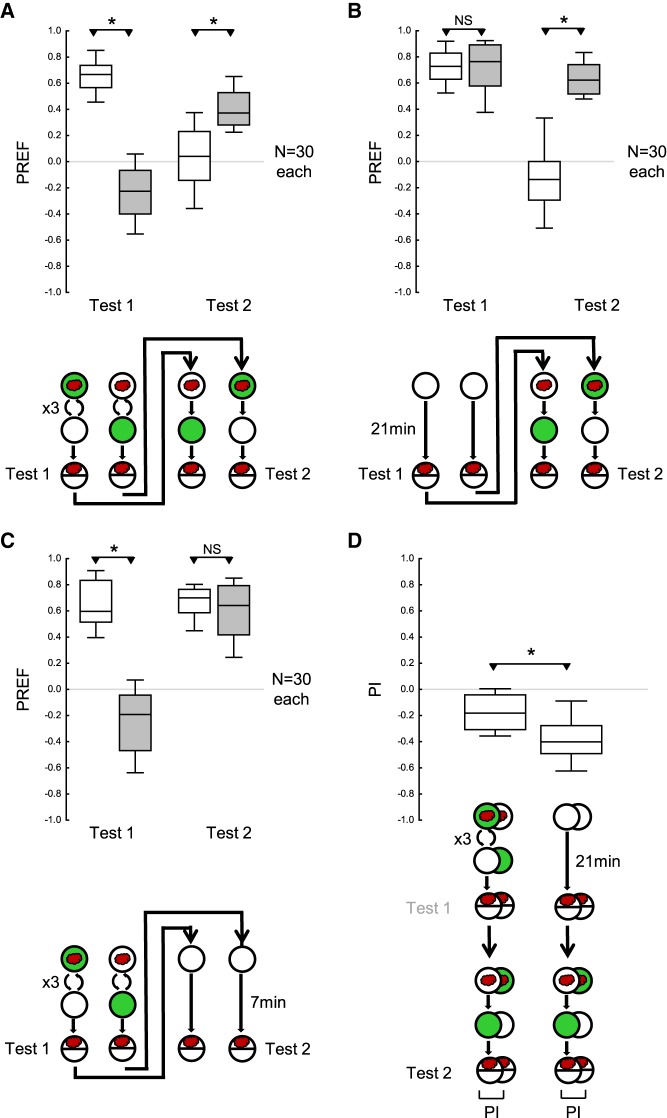
Figure 2.
Modification of the procedure allows memory for the first training phase to be detected. The larvae were trained and tested as in Figure 1, except that three cycles of training were given in the first training phase, and only a single cycle of training in the second training phase. (A) The larvae received three cycles of either paired odor–reward training or unpaired presentations of the odor and the reward, followed by the first test of odor preference (Test 1); then they received a second training phase with one cycle of training with reversed contingencies of the odor and the reward, followed by a second test of odor preference (Test 2). After the first training phase, the larvae behaved according to the odor–reward contingencies during the first training phase, whereas after the second training phase their behavior was largely in accordance with the reversed contingencies in the second training phase. (B) As in A, except that the first training phase was replaced by a 21 min waiting period. The larvae showed equal odor preference in the first test. In the second test, they behaved according to the odor–reward contingencies during the second training phase. (C) As in A, except that the second training phase was replaced by a 7 min waiting period. In the first test the larvae behaved according to the odor–reward contingencies during the first training phase; this effect had vanished by the time of the second test. (D) PI calculated from the difference in preference scores between paired versus unpaired training, for the second test of the experiments shown in A (left plot) and B (right plot), respectively. Negative PI scores indicate appetitive associative memory in accordance with the second training phase. PIs are less negative for larvae that had received odor–reward training during the first training phase, showing a residual associative effect of the training during that phase. Sample sizes are given within the figure. * and NS refer to MWU comparisons between groups (* P < 0.05 corrected according to Bonferroni-Holm and NS P > 0.05). Other details as in Figure 1.

