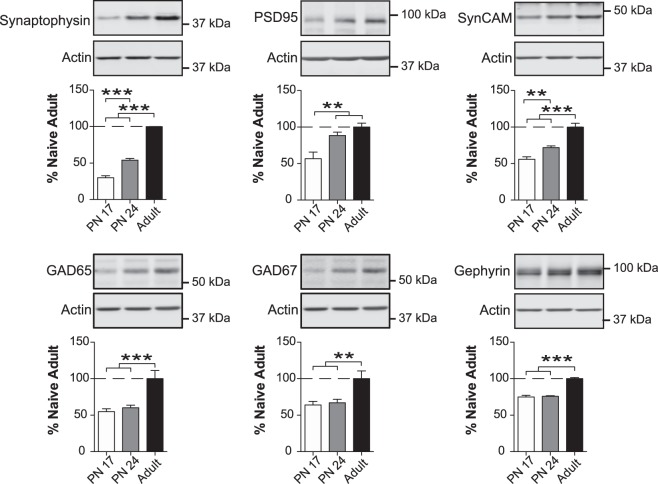
Figure 6.
Excitatory and inhibitory synapse maturation markers increase over the course of development. Densitometric western blot analyses were performed on total protein extracts of BLA from rats euthanized at PN17 (white, n = 6), PN24 (gray, n = 7), or PN80 (adult; black, n = 4–6). Data are expressed as mean percentage ± SEM of adult rat levels. One-way ANOVA followed by Newman–Keuls post-hoc tests: (**) P < 0.01; (***) P < 0.001.

