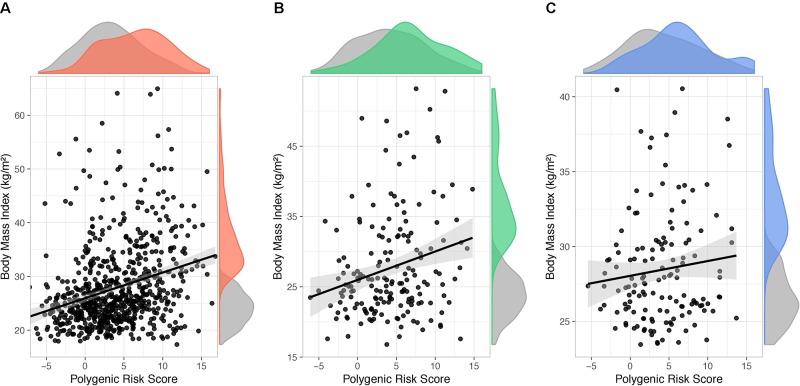
Figure 5.
Polygenic risk score PRS231 had a significant impact on body mass index. Scatter plots showing fitted linear mixed models including age, sex, and polygenic risk score PRS231 as fixed effects and family relatedness as random effect, with flexible covariance structure to account for family relatedness. The association between PRS231 and body mass index (BMI), measured as a continuous variable, with 95% confidence intervals (grey shade) is shown in (A) QFS discovery, (B) QFS validation, and (C) FAS replication samples. Density distributions of PRS231 and BMI are shown at the top and right of plots, respectively. Grey color represents subjects without obesity. Red, green and blue colors represent subjects with obesity in the (A) QFS discovery, (B) QFS validation, and (C) FAS replication samples, respectively. QFS and FAS stand for Quebec Family Study and Fatty Acid Sensor Study, respectively.

