
Figure 4.
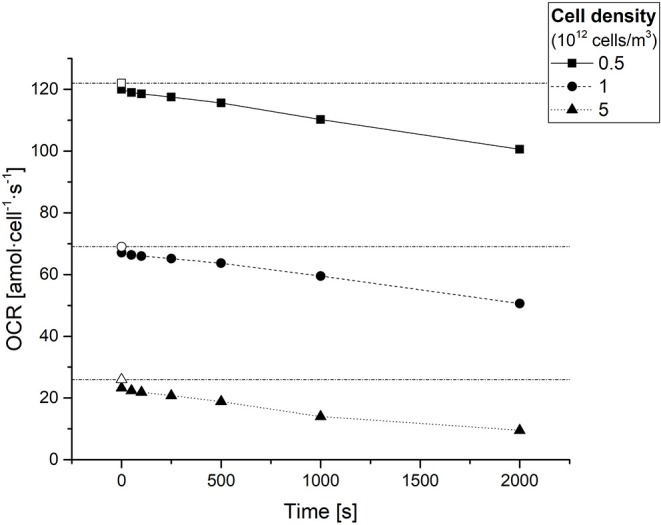
Average cellular oxygen consumption rate (OCR) in hepatocyte laden gels as a function of time for different cell densities. Empty symbols on the y-axis represent the respective (time-independent) sOCRs estimated for different cell densities. The dash-dotted horizontal lines serve only as a guide to the eye for identifying the three sOCR values.