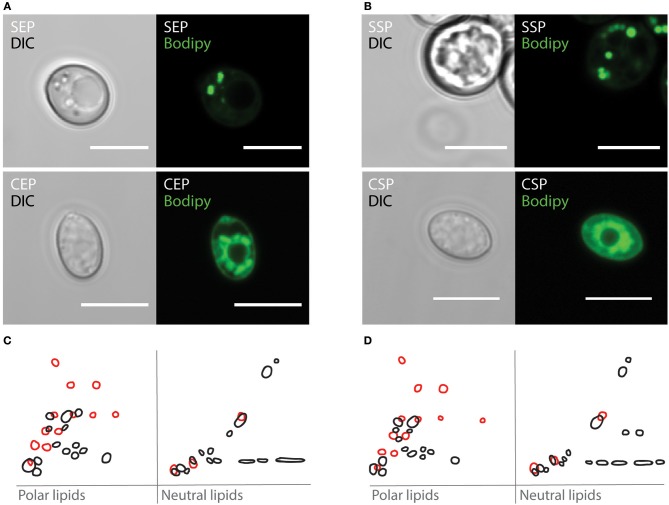
Figure 1.
Cystobasidium oligophagum and Saccharomyces cerevisiae have different lipid profiles. (A,B) Photographs of yeast harvested at specific growth stages probed with BODIPY-505. Shown are S. cerevisiae (S) or C. oligophagum (C) in exponential (EP) in (A) or stationary growth phase (SP) in (B). Scale bar = 5μm. (C,D) Shown are 2D-TLC profiles of polar and neutral lipids. Lipid signatures from S. cerevisiae (black) or C. oligophagum (red) from exponential (C) and stationary (D) growth stages.

