Figure 2.
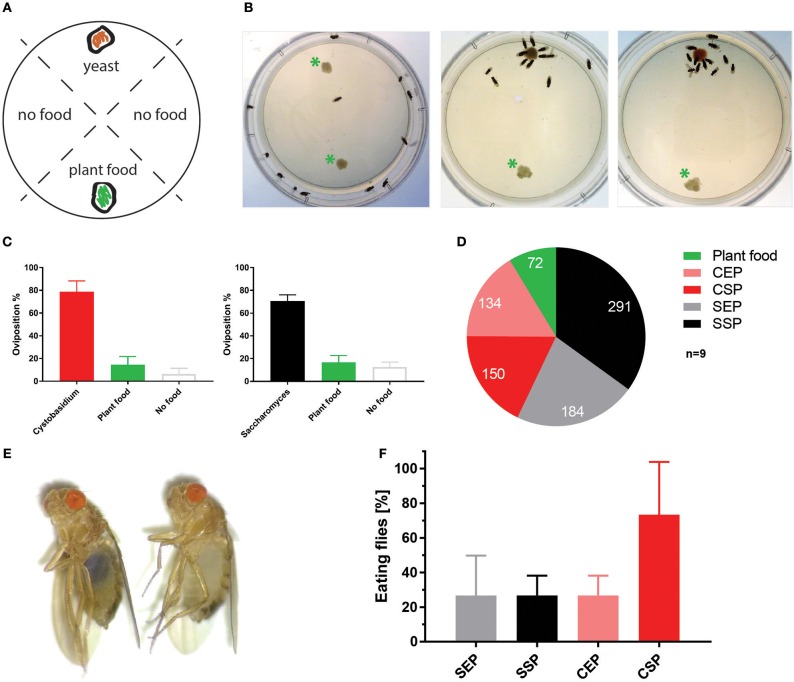
Cystobasidium oligophagum attracts Drosophila melanogaster. (A) Scheme that depicts our quantification approach. Assay plates are divided into four sectors loaded with food (yeast or plant food) or without a bait (no food). (B) Shown are screenshots from movies that show the feeding behavior of wild type flies. Photograph with control plate (left), plates testing S. cerevisiae (middle), or C. oligophagum (right). *Plant food bait. (C) Plotted are percentages of eggs positioned in different food sectors: S. cerevisiae (black), C. oligophagum (red), plant food (yellow), or no food (gray). (D) Depicted are total egg numbers (n = 9/food type) from flies fed with plant food, exponentially (EP), and stationary (SP) grown S. cerevisiae (S) or C. oligophagum (C). (E) Shown is a photograph of a fly feeding on blue-stained food (left) and a not feeding fly kept on the identical diet (right). (F) Plotted is the percentage of feeding wild type flies (n = 3, total of 15 mated females/food type) kept on different blue stained diets. Note, there is no significant difference between CSP and other samples (Dunn's multiple comparisons test: p > 0.05).

