Figure 4.
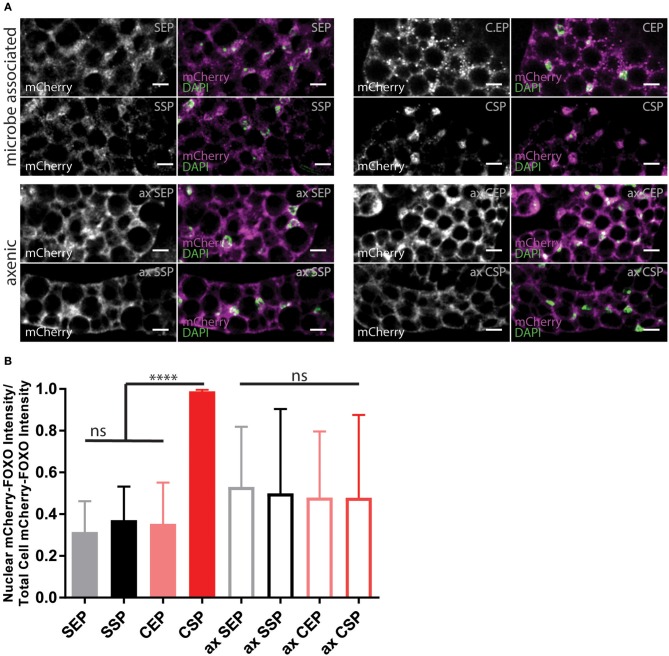
Yeast food quality and microbial load modulate dFOXO activity. (A) Photographs from larval fat bodies (early 3rd instar larvae). Samples were probed for mCherry-FOXO (magenta, white) and DAPI (green). Shown are samples from microbe associated (upper two panels) or axenic (ax, lower two panels) individuals kept on food based on stationary (SP) or exponentially (EP) grown S. cerevisiae (S) or C. oligophagum (C). Scale bars = 10μm. (B) Plotted is the quantification of mCherry-FOXO fluorescent intensity in nuclei of fat body cells (n ≥ 3 with ≥15 cells/sample). Differences between the mean values of groups were compared with Tukey's multiple comparisons test. n.s., none significant; ****p < 0.0001. P-values: SEP vs. CSP p < 0.0001, SEP vs. ax SEP p = 0.0019, SEP vs. ax SSP p = 0.0275, SSP vs. CSP p < 0.0001, CEP vs. CSP p < 0.0001, CEP vs. ax SEP p = 0.0192, CSP vs. ax SEP p < 0.0001, CSP vs. ax SSP p < 0.0001, CSP vs. ax CEP p < 0.0001, CSP vs. ax CSP p < 0.0001.

