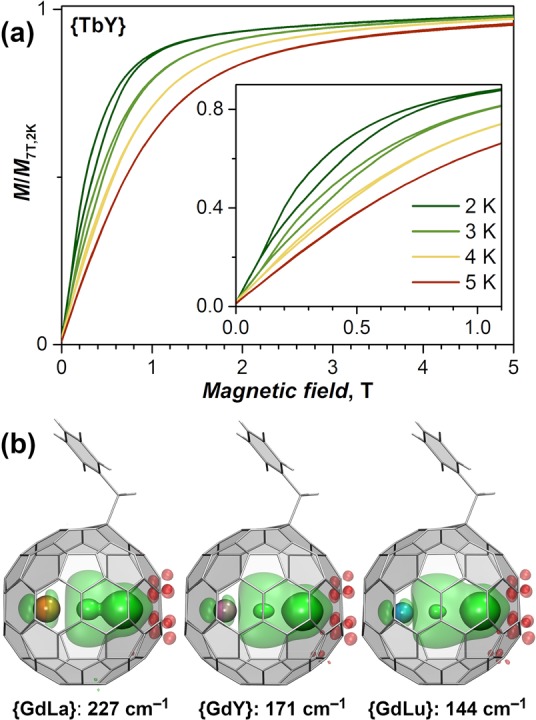
Figure 10.

(a) Magnetization curves for {TbY} below 5 K. Reproduced with permission from ref (22). Copyright 2019 Springer Nature. (b) DFT-computed spin density distribution and Gd electron exchange coupling constants in {GdLa}, {GdY}, and {GdLu} (PBE0/DKH-TZVP level of theory; the isosurface visualization parameters are the same as in Figure 2).
