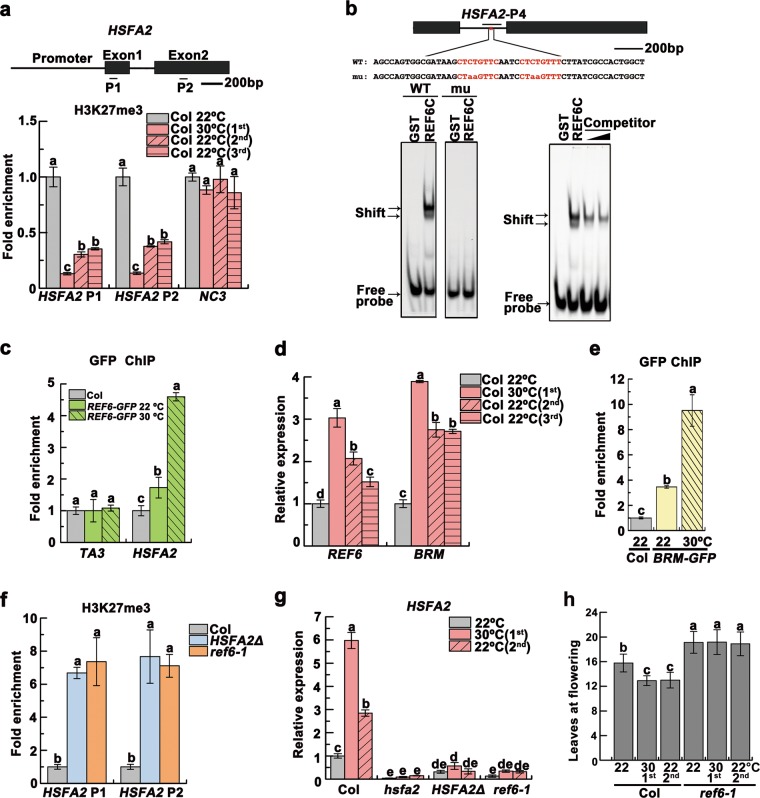
Fig. 4.
H3K27me3 demethylation controls transgenerational upregulation of HSFA2. a H3K27me3 levels detected by ChIP-qPCR at the HSFA2 loci. The gene model was shown and the analyzed regions (P1 and P2) were indicated. One intergenic region (NC3) without H3K27me3 mark28 was used as negative background. b EMSA showed HSFA2 probe binding to GST-REF6C containing the C2H2-ZnF cluster. The mutant probe abolished the binding of GST-REF6C. Excess unlabeled probe outcompeted the labeled probe (right panel). The motif is highlighted in red in the probe sequence, with mutated bases shown in lowercase. The region validated by ChIP-qPCR in c was marked by a bar. c ChIP-qPCR validation of REF6 binding at HSFA2 using the REF6-GFP plants. Col was used as the negative control. The TA3 locus was used as the negative-control locus. d Transcript levels of REF6 and BRM, shown as mean ± SD (n = 3). e ChIP-qPCR validation of BRM binding at HSFA2 using the BRM-GFP plants. Col was used as the negative control. f H3K27me3 levels of HSFA2 in the HSFA2Δ and ref6–1 plants. The data were normalized to the corresponding input fraction (a, c, e, f). g HSFA2 transcript levels. Data were shown as means ± SD from three replicates (a, c–g). h Flowering times of indicated lines were assessed (n ≥ 15 for each line). Lowercase letters indicate statistical significance based on one-way (a, c–f) or two-way (g, h) ANOVA with Tukey’s HSD post hoc analysis (P < 0.05)

