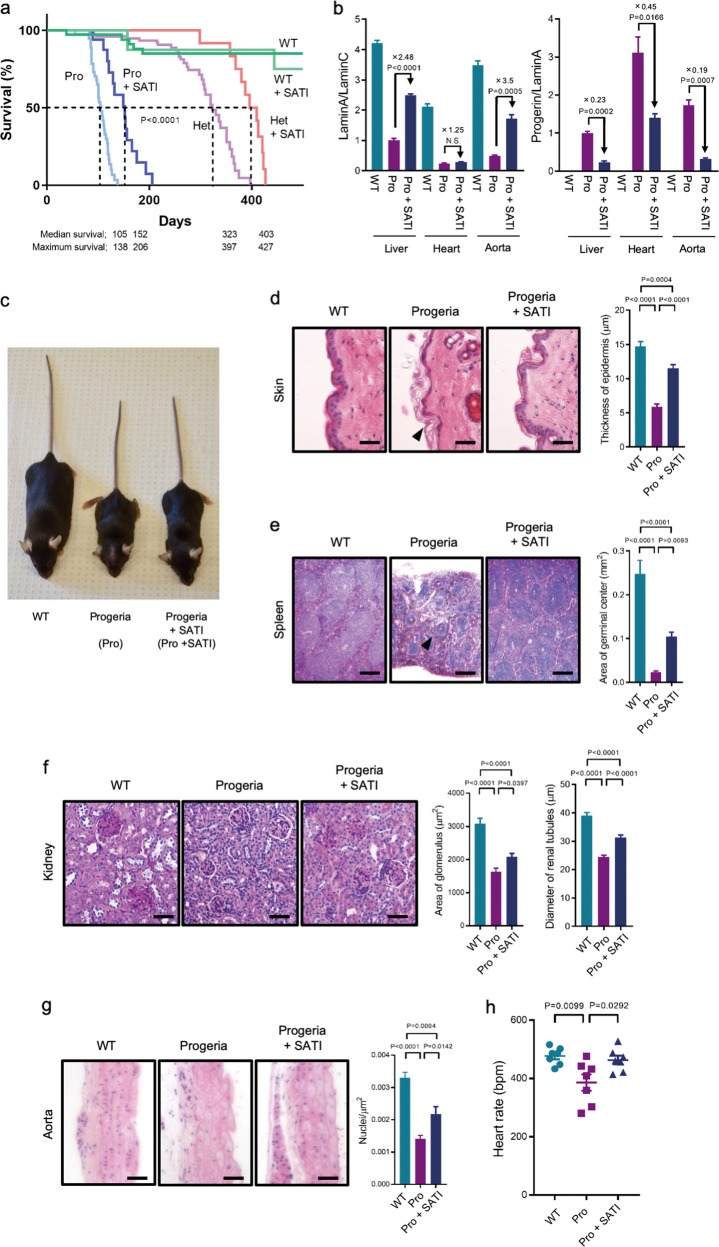
Fig. 3.
Prevention of aging phenotypes and molecular analyses in the SATI-treated progeria mice. a Survival plots of Lmna+/+ (WT), SATI treated Lmna+/+ (WT+SATI), LmnaG609G/G609G (Pro), SATI treated LmnaG609G/G609G (Pro+SATI), Lmna+/G609G heterozygous (Het), SATI treated Lmna+/G609G heterozygous (Het+SATI) mice. WT, n = 72; WT+SATI, n = 8; Het, n = 33; Het+SATI, n = 11; Progeria, n = 25; Progeria+SATI, n = 15. P < 0.0001 according to log-rank (Mantel-Cox) test. Median survival and maximum survival date of each group are indicated at bottom. b RT-qPCR analysis for the expression ratio of Lamin A to Lamin C (left) and Progerin to Lamin A (right) from represented tissues (n = 3). Expression level of each gene is normalized by Gapdh first, and then ratio is calculated. Relative values after SATI treated are indicated. Data are represented as mean ± s.e.m. Each P-value is indicated according to unpaired Student’s t-test. N.S., not significant. Relative ratios are indicated at top of each graph. c Representative photographs of WT, Progeria (Pro), and Progeria+SATI (Pro+SATI) mice at 17 weeks old. d–g Histological analysis of skin d, spleen e, kidney f, and aorta g at 17 weeks old. Left: representative pictures of hematoxylin and eosin (H&E) staining. Middle and right: quantitative analyses represented as mean ± s.e.m. d–g Skin, n = 39; spleen, n = 20; kidney glomerulus, n = 20; kidney renal tubules, n = 50; aorta, n = 9. Scale bars: skin, kidney, and aorta 100 μm, spleen 250 μm. Black arrowheads indicate decreased epidermal thickness and increased keratinization d, and small lymphoid nodules in the splenic white pulp e. The thickness of epidermis is significantly decreased in untreated mice and restored in SATI treated mice d. The area of germinal center is significantly decreased in untreated mice and restored in SATI-treated mice e. The area of glomerulus (middle panel) and diameter of renal tubules (right panel) are significantly decreased in untreated mice and restored in SATI treated mice f. The density of aortic nuclei is significantly decreased in untreated mice and restored in SATI-treated mice g. P-values are indicated in each graph, one-way ANOVA with Tukey’s multiple comparisons test d–g. h Electrocardiogram (ECG) analysis in WT, Pro, and Pro+SATI mice between day 92 and day 110. Heart rate represented as beats per minute (bpm), n = 7. P-values are indicated in each graph, one-way ANOVA with Tukey’s multiple comparisons test

