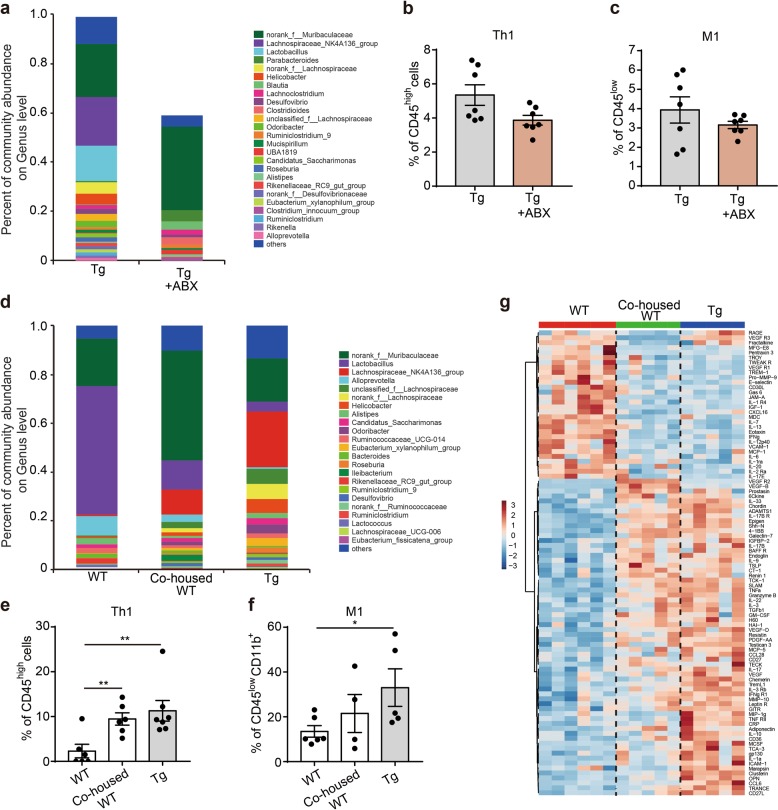
Fig. 2.
The gut microbiota is required for immune cell infiltration and microglial activation. a The effects of five-month oral gavage of antibiotics on the relative abundance of gut microbes in 7-month-old 5XFAD transgenic (Tg) mice (n = 5–7). ABX, a cocktail of mixed antibiotics composed of ampicillin (0.1 mg/mL), streptomycin (0.5 mg/mL) and colistin (0.1 mg/mL). Different genera of gut microbes are coloured differently, and their changes in relative abundance are presented on the barplot. The abundance of Bacteroides in Tg mice is below 0.01 and was thus not shown in both groups. b-c The effects of five-month oral gavage of antibiotics on the frequency of Th1 cells (b) and M1-type microglia (c) in the brain homogenate of 7-month-old 5XFAD transgenic (Tg) mice. Cell counts of Th1 cells (CD45highCD4+CXCR3+) are presented relative to the frequency of CD45high cells (b), while those of M1-type microglia (CD45lowCD11b+CX3CR1+Siglec-H+CD86+) are presented relative to the frequency of CD45low cells (c). Both are detected by flow cytometry, n = 7, the data are presented as mean ± standard error of the mean (mean ± SEM). d The relative abundance of gut microbes at the genus level in WT, co-housed WT and 5XFAD transgenic (Tg) mice (n = 6–7). All three groups of mice were at 7-month old. Different colours represent different genera. Co-housed WT: WT mice that were housed with Tg mice. e-f Changes in the frequency of Th1 cells (e) and M1 type microglia (f) in the brain homogenates of 7-month-old WT, co-housed WT and 5XFAD transgenic (Tg) mice (n = 4–7). Th1 cells (CD45highCD4+CXCR3+) are presented relative to the frequency of CD45high cells (e), while the frequency of M1-type microglia (CD45lowCD11b+CX3CR1+Siglec-H+CD86+) are presented relative to the frequency of CD45lowCD11b+ cells (f). Both are detected by flow cytometry. The data are presented as mean ± standard error of the mean (mean ± SEM). *P < 0.05, **P < 0.01 by Student’s t-test. g Levels of cytokine proteins in the brain homogenates of WT, co-housed WT and 5XFAD transgenic (Tg) mice at 7-month old as detected by a cytokine antibody array (n = 5–6). Colours in the heatmap indicate relative cytokine levels; red indicates cytokines that are upregulated, and blue indicates cytokines that are downregulated

