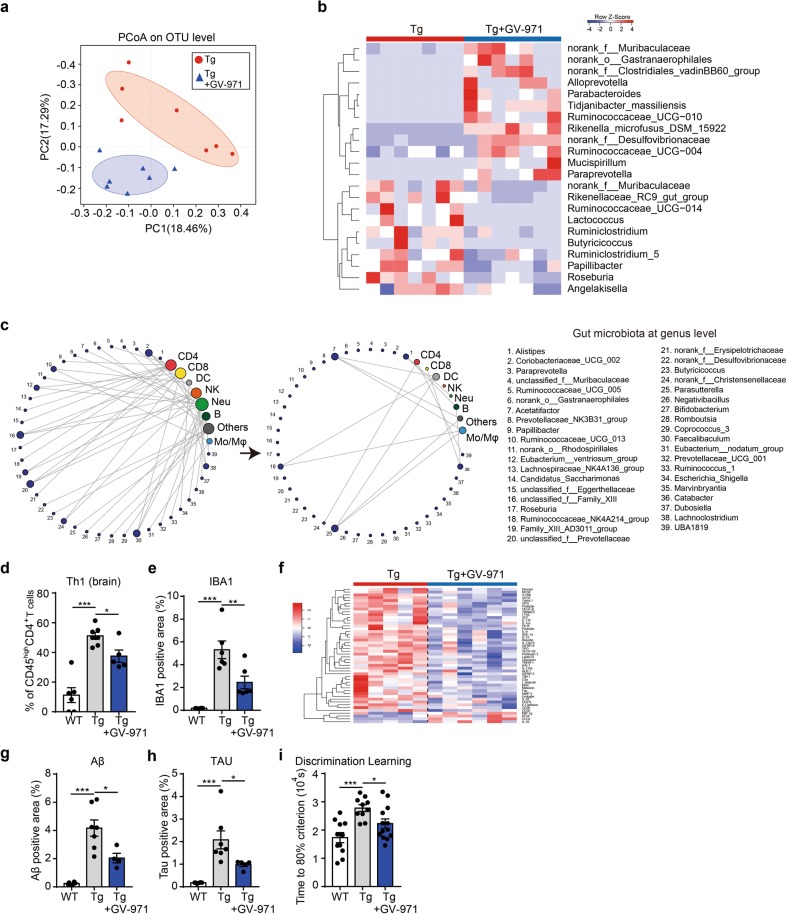
Fig. 4.
GV-971 alleviates neuroinflammation by reconditioning the gut microbiota. a Principal coordinate analysis (PCoA) of the gut microbiome composition on the operational taxonomic unit (OTU) level based on the Bray-Curtis distance for 5XFAD (Tg) mice and GV-971-treated Tg mice at 7-month old (n = 7). The shapes and colours of the points indicate samples from each individual. Coloured ellipses indicate 0.95 confidence interval (CI) ranges within each tested group. PC principal component. b Heatmap of significant gut microbiota changes represented at the genus level between 5XFAD (Tg) mice and GV-971-treated Tg mice at 7-month old (n = 7). Colours on the heatmap indicate the relative abundance of gut microbiota; red indicates bacteria that are upregulated, and blue indicates bacteria that are downregulated. Gut microbiota with significant changes were chosen using a Wilcoxon rank-sum two-tailed test with P-value that is less than 0.05 between Tg and GV-971-treated groups. f family, o order. c Changes in correlational links between the gut microbiome at the genus level (designated with numbers near the purple circles) and brain lymphocytes (other coloured circles) before (left) and after (right) oral gavage of GV-971 in 7-month-old 5XFAD (Tg) mice (n = 5–7). Lines represent either significant (P-value < 0.05) positive or negative correlation (Pearson coefficient). The size of each circle of immune cells are positively related to the links connected to this circle. The right side lists the name of each gut microbiome, also see “Materials and methods”. f family, o order, DC dendritic cells, NK natural killer cells, Neu neutrophils, B B cells, Mo/Mϕ monocytes and macrophages. d Effect of GV-971 treatment on the frequency of brain Th1 cells in 5XFAD (Tg) mice at 7 months old (n = 5–7). Th1 cell counts (CD45highCD4+CXCR3+) are presented relative to CD45highCD4+ T cell counts detected by flow cytometry. The data are presented as mean ± standard error of the mean (mean ± SEM). *P < 0.05, ***P < 0.001, by Student’s t-test. e Effect of GV-971 treatment on the positive signal density of IBA1 immunofluorescent staining detected in hippocampal slices from 5XFAD (Tg) mice at 7-month old, reflecting activation of microglial cells (n = 4–6). The data are presented as mean ± standard error of the mean (mean ± SEM). **P < 0.01, ***P < 0.001, by one-way ANOVA (F (2, 15) = 21.94). f Effect of GV-971 treatment on levels of cytokine proteins in the brain homogenates of 5XFAD (Tg) mice at 7-month old as detected by a cytokine antibody array (n = 5–6). Colours on the heatmap indicate relative cytokine levels; red indicates cytokines that are upregulated, and blue indicates cytokines that are downregulated. g, h Effect of GV-971 on Aβ-positive area (g) and tau-positive area (h) in the hippocampus of 5XFAD (Tg) mice at 7-month old, evaluated in brain slices (n = 4–7). The data are presented as mean ± standard error of the mean (mean ± SEM). For Aβ analysis: *P < 0.05, ***P < 0.001 (F (2, 14) = 22.78). For tau analysis: *P < 0.05, ***P < 0.001 (F (2, 15) = 13.06) by one-way ANOVA. i Effects of GV-971 on the time out of 104 sec (s) taken to achieve 80% success (see “Materials and methods”) in a test to evaluate the discrimination learning abilities of 5XFAD (Tg) mice at 7-month old (n = 10–13). Time means the time to reach the 80% performance level (seconds); the longer it takes, the severer the cognitive impairment is (see “Materials and methods”). *P < 0.05, ***P < 0.001 by One-way ANOVA (F(2,31) = 9.751). The concentration of GV-971 was 100 mpk for all of the above results

