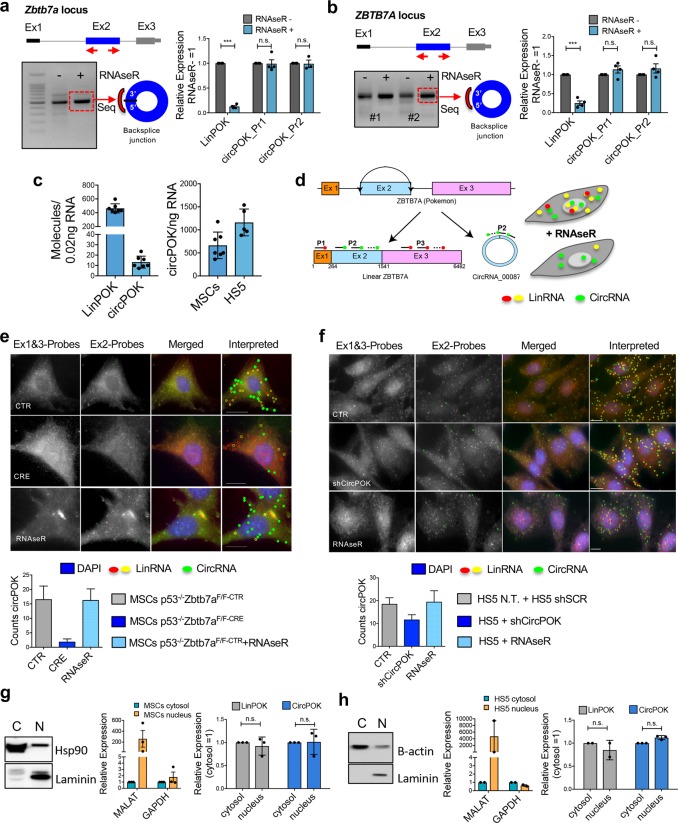
Fig. 1.
CircPOK is generated from the Zbtb7a genomic locus through back splicing of the Exon 2. a Analysis of the expression of mouse circPOK in primary p53−/− MSCs. circPOK was detected by PCR with divergent primers, and the amplicon was subjected to Sanger sequencing. RT-qPCR analysis of LinPOK and circPOK before and after treatment with RNase R is shown in the chart on the right. In the chart, circPOK_Pr1 and circPOK_Pr2 refer to independent divergent primer sets used to identify mouse circPOK (n ≥ 3 independent experiments). b Analysis of the expression of human circPOK in the HS5 mesenchymal cell line. circPOK was detected by PCR with divergent primers, and the amplicon was subjected to Sanger sequencing. RT-qPCR analysis of LinPOK and circPOK before and after treatment with RNase R is shown in the chart on the right. circPOK_Pr1 and circPOK_Pr2 refer to independent divergent primer sets used to identify human circPOK (n ≥ 3 independent experiments). c Absolute quantification of mouse LinPOK and circPOK in p53−/− MSCs is shown in the chart on the left (n = 7). Absolute quantification of mouse and human circPOK in p53−/− MSCs (mouse, n = 7) and HS5 cells (human, n = 5) is shown in the chart on the right. d Schematic representation of the circFISH assay. e circFISH analysis of mouse circPOK in primary p53−/−Zbtb7a_Ex2F/F MSCs, transduced with a CTR vector (upper panels), with a vector expressing CRE (panels in the middle), or CTR cells treated with the RNase R (bottom panels). The chart at the bottom represents the number of molecules of circPOK per cell in the three different conditions analyzed. (n = 100 cells accounted for each condition, and the mRNA copy numbers were obtained using average counts per cell with 95% confidence interval). f circFISH analysis of human circPOK in HS5 mesenchymal cell line, transduced with a CTR vector (shSCR, upper panels), with an shCircPOK (panels in the middle), or CTR cells treated with RNase R (bottom panels). The chart at the bottom represents the number of molecules of circPOK per cell in the three different conditions analyzed. (n = 100 cells accounted for each condition, and the mRNA copy numbers were obtained using average counts per cell with 95% confidence interval). g Nucleus/Cytosol fractionation experiments to identify LinPOK and circPOK in mouse p53−/− MSCs. Western blot (Hsp90 and Laminin) and RT-qPCR (Malat and Gapdh) to confirm the fractionation are shown on the left, while RT-qPCR analyses of the transcripts are shown with the charts on the right. h Nucleus/Cytosol fractionation experiments to identify LinPOK and circPOK in human HS5 cell line. Western blot (b-actin and Laminin) and RT-qPCR (Malat and Gapdh) to confirm the fractionation are shown on the left, while RT-qPCR analyses of the transcripts are shown with the charts on the right

