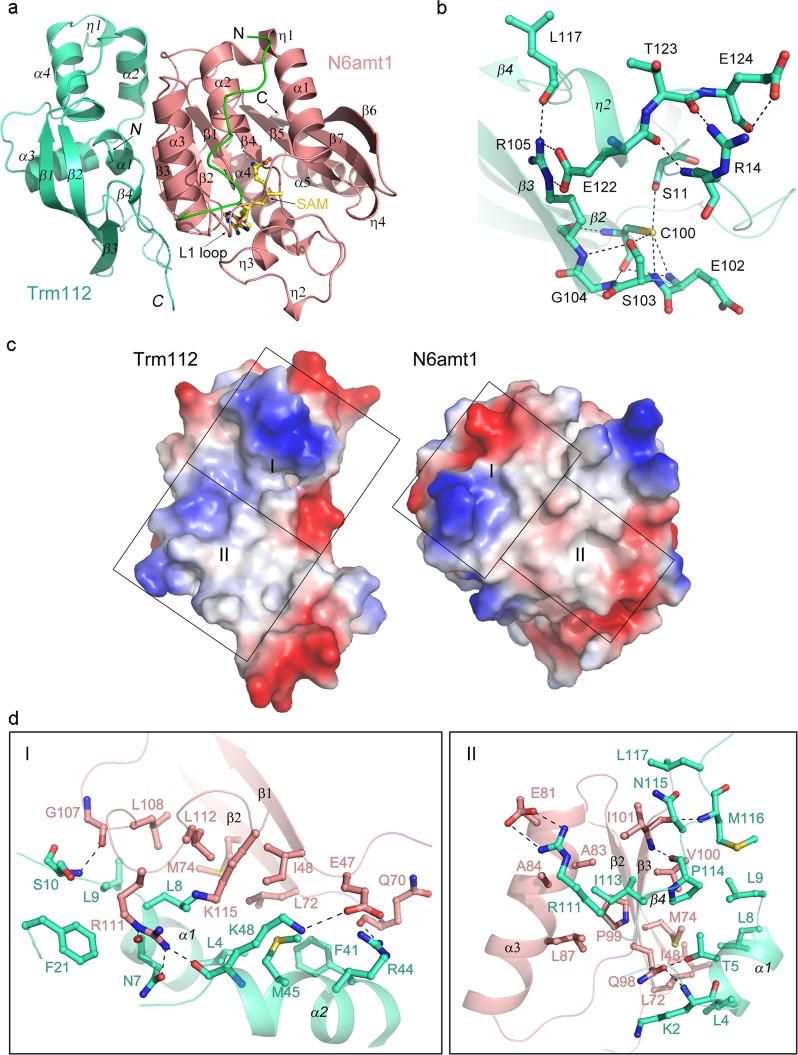
Fig. 1. Crystal structure of human N6amt1–Trm112 complex.
a Overall structure of Se-Met derivative N6amt1–Trm112 complex in ribbon diagram. N6amt1 and Trm112 are colored in salmon and green-cyan, respectively. The extra visible N-terminal loop of N6amt1 defined in the structure of the derivative complex is colored in green. The bound cofactor SAM is shown with a ball-and-stick model and colored in yellow. The secondary structure elements are indicated. The secondary structure elements of Trm112 are labeled in italics. b Structure of the “S(R/K)CS motif” of Trm112. The key residues involved in the hydrogen-bonding interactions with this motif are shown with ball-and-stick models. The hydrogen bonds are indicated with black dotted lines. c Electrostatic potential surfaces of Trm112 and N6amt1 at the interaction interface, which is the open-book view of Fig. 1a. The surface charge distribution is displayed as blue for positive, red for negative, and white for neutral. For clarity, the interface is divided into two regions to show the detailed interactions. d The zoom-in windows show the detailed interactions in the two regions of Fig. 1c. The residues involved in the interactions are shown with ball-and-stick models. The color coding is the same as Fig. 1a. The hydrogen bonds are indicated with black dotted lines

