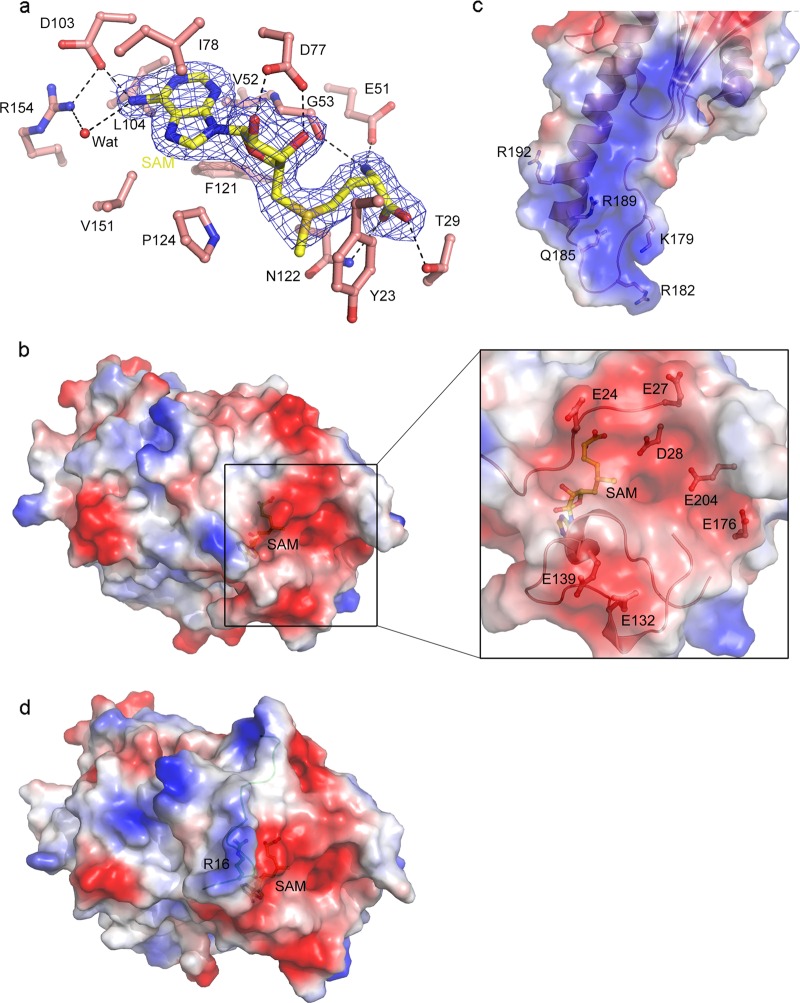
Fig. 2. Structures of the active site and the potential substrate-binding site of N6amt1.
a Interactions of SAM with N6amt1. The residues interacting with the cofactor are shown with ball-and-stick models. A water molecule involved in the hydrogen-bonding network is shown with a sphere and colored in red. A representative composite-simulated annealing omit map (2Fo-Fc, contoured at 1.0 σ level) for SAM is shown with the blue grids. b Electrostatic potential surface of native N6amt1–Trm112 complex in the same view as Fig. 1a. The zoom-in window shows the acidic residues composing the active site and the potential substrate-binding site. c Electrostatic potential surface around the GGQ motif of human eRF1 in the eRF1–eRF3 complex (PDB code 3E1Y). Gln185 and the adjacent basic residues are shown with ball-and-stick models. d Electrostatic potential surface of the Se-Met derivative N6amt1–Trm112 complex in the same view as Fig. 1a. The extra visible N-terminal loop is shown in ribbon and colored in green. The cofactor SAM and key residues are shown with ball-and-stick models

